question

Patrick Zweekhorst avatar image
0 Likes"
Patrick Zweekhorst asked Patrick Zweekhorst commented

Average content time chart of process flow gives wrong values

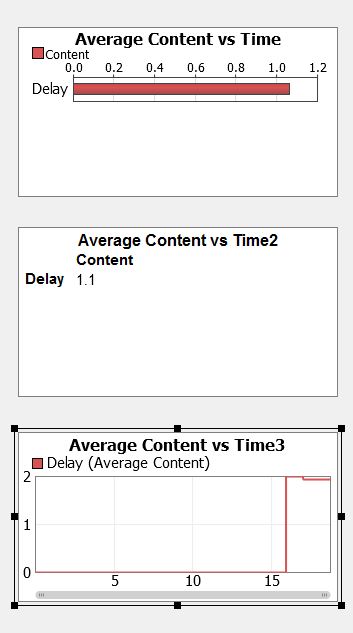
I want to make a time chart of the average content of a delay activity in a process flow. I used the average content vs time chart for the process flow to do this, but the time chart does not give the correct results. The table of values and the bar chart option do give the correct result. The attached picture shows this difference. (I also attached a small model which makes these graphs).

How can I make a correct time chart of the average content?

FlexSim 16.1.0
process flowdashboardstime chartaverage content
5 |100000

Up to 12 attachments (including images) can be used with a maximum of 23.8 MiB each and 47.7 MiB total.

1 Answer

·
Sam Stubbs avatar image
1 Like"
Sam Stubbs answered Patrick Zweekhorst commented

This is a bug that's currently in the works getting resolved, that is specifically to do with monitoring the Delays in Process Flow. In the meantime however, one solution might be to have the Process Flow logic create a flow item into a Queue for the duration of the delay, then remove it when it's done, and you can run the statistics on the Queue, and that should get you the values you want. I've included an example of this attached below. 1310-avgcontent.fsm


1310-avgcontent.fsm (16.5 KiB)
· 1
5 |100000

Up to 12 attachments (including images) can be used with a maximum of 23.8 MiB each and 47.7 MiB total.

Patrick Zweekhorst avatar image Patrick Zweekhorst commented ·

Thanks for your solultion.

0 Likes 0 ·

Write an Answer

Hint: Notify or tag a user in this post by typing @username.

Up to 12 attachments (including images) can be used with a maximum of 23.8 MiB each and 47.7 MiB total.