question

Ghadir S avatar image
0 Likes"
Ghadir S asked Ghadir S edited

Dashboard - State Bar Chart for Process flow

Hi,

So, little I knew, apparently I can't connect my process to Dashboard as easy as connecting objects.
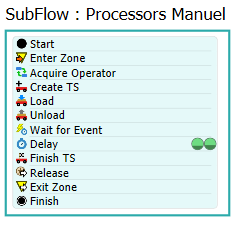
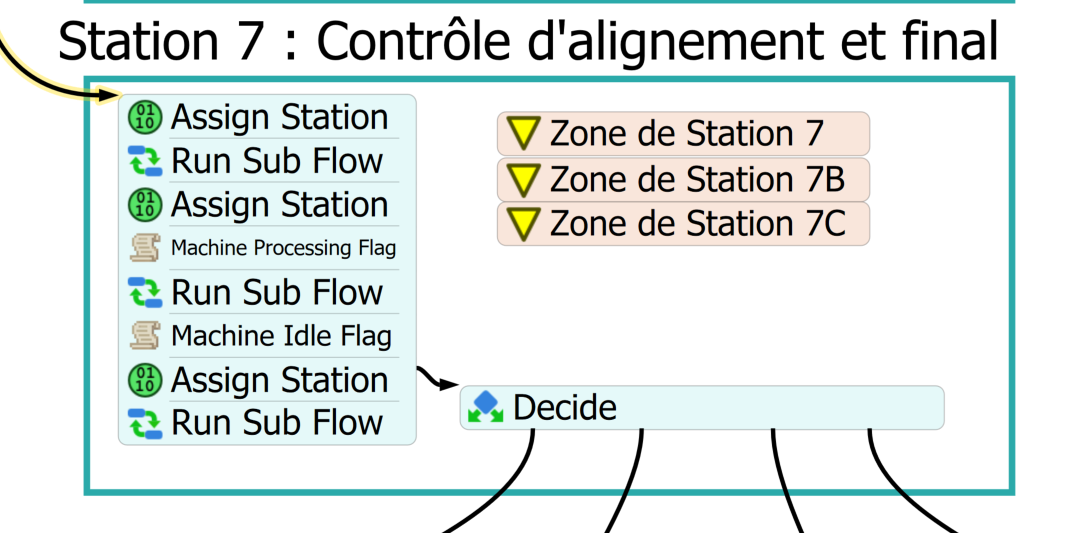
I'm trying to create State Bar Chart for my operators and manual machines that are built in Process flow. My goal is to observe their occupation. I seek something like these two charts.

1681669534582.png

1681669573185.png


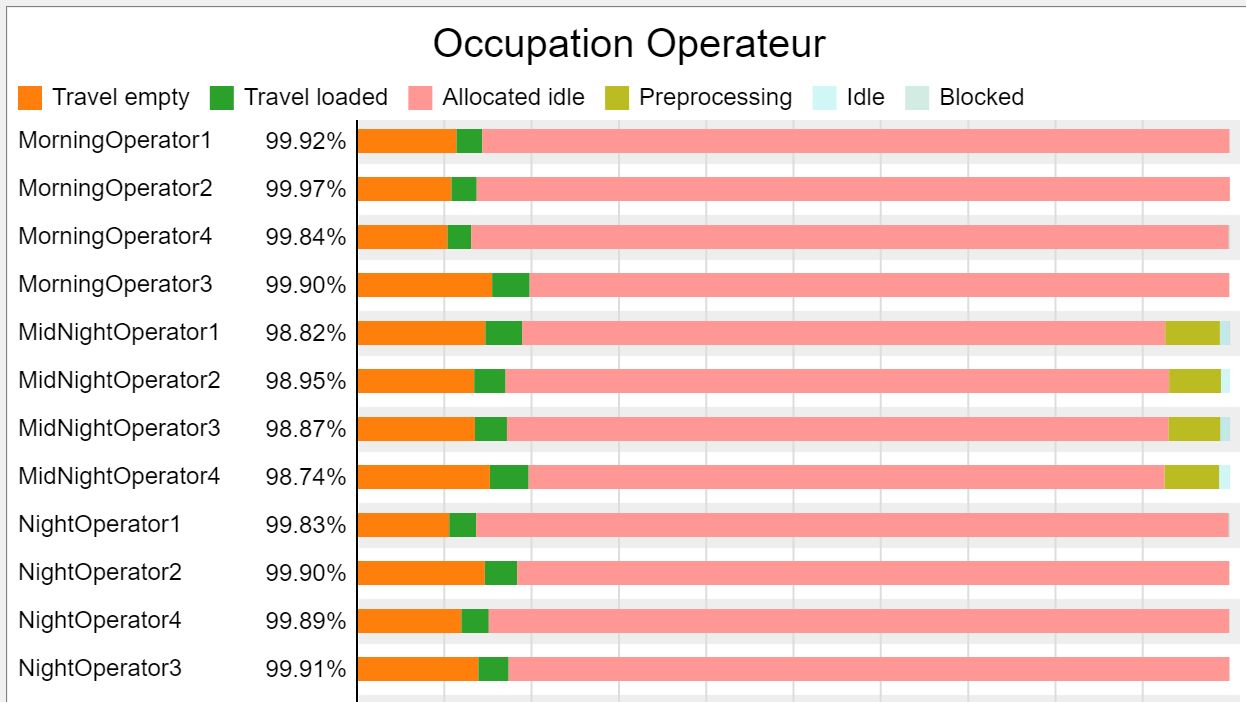
I really appreciate your help.


LigneP3VersionFinal.fsm

FlexSim 21.2.4
process flowdashboardsstate bar chart
5 |100000

Up to 12 attachments (including images) can be used with a maximum of 23.8 MiB each and 47.7 MiB total.

1 Answer

Felix Möhlmann avatar image
1 Like"
Felix Möhlmann answered Ghadir S edited

I assume you are talking about this activity block, where the delay activity represents manual processing time that you want to see represented both in the state chart of the operators as well as in a state chart for the (virtual) work stations?

capture1.png

For the operators you can use a delay task in place of the standard delay to control which state while they are in during that time.

capture2.png

To get a chart of the work station utilization it is in my opinion easiest to add dummy objects (BasicFR) to the model and set their state in the process flow (option for this is available in the Custom Code activity). You could track the state in a tracked variable that you add elsewhere (as a label or a custom subnode) but it'd be more work to get those to work with the state chart than to add some extra objects.

Though at the moment I don't see any resource/list/zone that represents those work stations, so are they even limited in number?


capture1.png (11.7 KiB)
capture2.png (13.3 KiB)
· 1
5 |100000

Up to 12 attachments (including images) can be used with a maximum of 23.8 MiB each and 47.7 MiB total.