question

Alejandro Cevallos avatar image
0 Likes"
Alejandro Cevallos asked Adrian Haws edited

How I can visualize the amount of products leaving (output) of different item types via a dashboard?

I have different item types in my simulation and I need to visualize how many products of each item type leave. I don't know which graph of the dashboard should I use and if is necessary program.

FlexSim 7.5.4
dashboardsitemtypeoutputzone subset
5 |100000

Up to 12 attachments (including images) can be used with a maximum of 23.8 MiB each and 47.7 MiB total.

1 Answer

·
Adrian Haws avatar image
3 Likes"
Adrian Haws answered Adrian Haws commented

Alejandro,

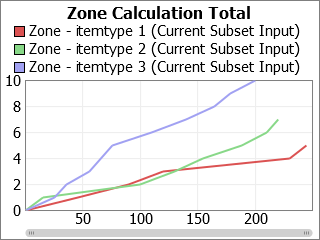
A simple way to do this is by starting a Process Flow with an Event-Triggered Source and utilizing Zone statistics in the dashboard. You will need a reference to the flowitem's itemtype in the Process Flow, and use that reference to create Zone subsets.

I included a sample model of what this might look like. Let us know if you have any questions.


zone-stats.png (13.3 KiB)
zone-stats.fsm (21.9 KiB)
· 2
5 |100000

Up to 12 attachments (including images) can be used with a maximum of 23.8 MiB each and 47.7 MiB total.

Alejandro Cevallos avatar image Alejandro Cevallos commented ·

Thanks Adrian. It worked very well.

0 Likes 0 ·
Adrian Haws avatar image Adrian Haws Alejandro Cevallos commented ·

Glad to hear it, Alejandro

0 Likes 0 ·

Write an Answer

Hint: Notify or tag a user in this post by typing @username.

Up to 12 attachments (including images) can be used with a maximum of 23.8 MiB each and 47.7 MiB total.