question

Cindy Azuero avatar image
1 Like"
Cindy Azuero asked Jason Merschat commented

Wrong statistic graphics in process flow

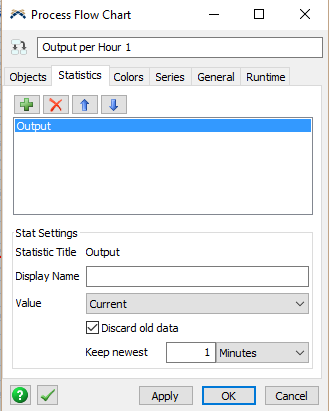
outputperhour.fsmI was trying to obtain the output per minute statistic from an activity on the process flow. First I attempt to Pin the output statistic of the activity to the dashboard and then I modify the graph properties as follow.

I though that this will return the output value after every minute has passed.

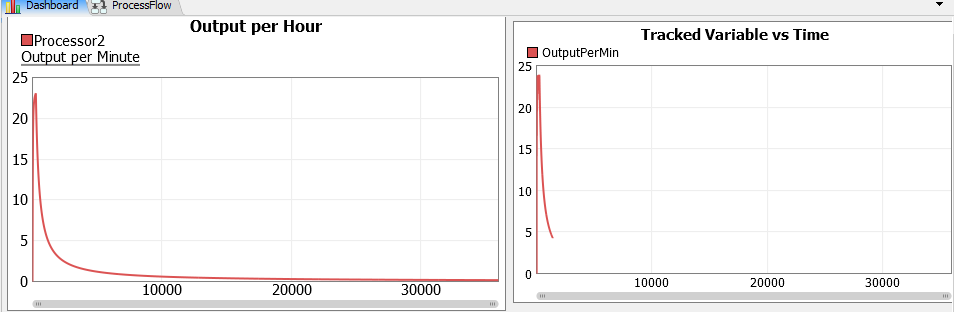
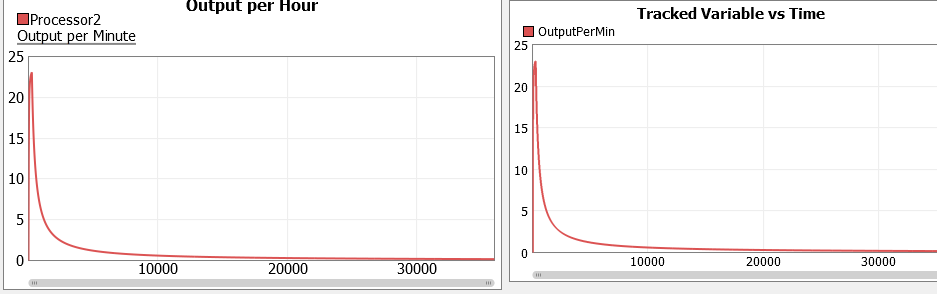
Then I realized that that is not the same as output per minute, because I thought it was only taking the last data of output in the range I established. So, I used the predefined option of the library for process flow statistics called Output per hour and I realized it has the same configuration as the one I configured above. In this manner of facts, I realize that the graph is not really calculating the output per hour. To confirm that, I create the same statistic using the objects from the 3D view where a know the statistic is well calculated and as I expected the graphics are different.

I'm sending you the model where I test this.

FlexSim 16.1.2
process flowstatistics
outputperhour.fsm (22.4 KiB)
· 4
5 |100000

Up to 12 attachments (including images) can be used with a maximum of 23.8 MiB each and 47.7 MiB total.

Matt Long avatar image
2 Likes"
Matt Long answered Matt Long commented

The two graphs are different. The standard Content vs Time graph that you set up to be Output Per Minute is doing calculating the output per hour as the model runs. You could think of this as more of a running average. The equation that chart is using to get each of its data points is:

  1. output / (time / 60)

The Process Flow chart is giving you the actual Output Per Minute. It does this by recording the output each time it changes and then graphing the last minutes worth of data.

If you want to display a graph of the output / (time / 60) using Process Flow, you can write that data to a tracked variable and then graph the tracked variable. Create a Tracked Variable through the Toolbox with the Level type. Then somewhere in your Process Flow add the code:

  1. treenode delay = getactivity(processFlow, "Delay");
  2. settrackedvariable("OutputPerMin", getstat(delay, "Output", STAT_CURRENT) / (time() / 60.0));

Then create a Tracked Variable vs Time chart in the Dashboard that is linked to your OutputPerMin tracked variable.

· 7
5 |100000

Up to 12 attachments (including images) can be used with a maximum of 23.8 MiB each and 47.7 MiB total.

Adrian Haws avatar image
1 Like"
Adrian Haws answered Cindy Azuero commented

Cindy,

That's right, that's how it's supposed to work. The "Output per Hour" for a Process Flow activity displays the output value for the last hour (or whatever time unit you have set) while this statistic for a fixed resource displays the average output per such time unit over the entire run time.

If you want to display an activity's average output per minute, you can create a text display in your Process Flow and enter code similar to this:

  1. treenode delay = getactivity(processFlow, "Delay");
  2. if (time() == 0)
  3. return 0;
  4. return getstat(delay, "Output", STAT_CURRENT) / (time() / 60.0);

See example model below.


· 1
5 |100000

Up to 12 attachments (including images) can be used with a maximum of 23.8 MiB each and 47.7 MiB total.