question

Lou Keller avatar image
0 Likes"
Lou Keller asked Cliff King commented

Why do different graphs based on the same data show different results?

Submitted on behalf of Jim Montgomery, Carilion Clinic. Regarding the attached model, why would the “N” of my data result graphs be so different when comparing Milestone-minus-Milestone-Time graphs with Data-Collector-User-Defined graphs? The two graphs should demonstrate the same results and have the same sample size.

The Milestone-Milestone data points are created when the time the patient enters the exam room is subtracted from the time the patient concludes triage.

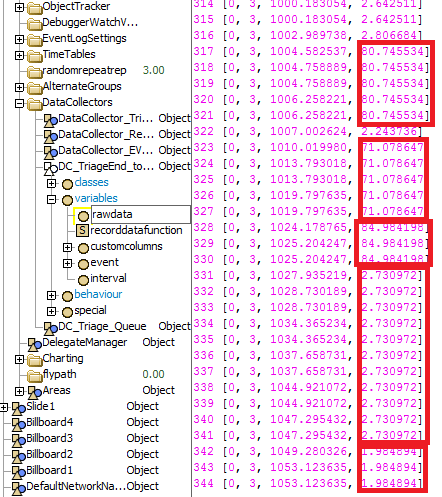
The Data-Collector data points are created each time the global variable “v_TriageEnd_to_Roomed” is updated.

Here’s the problem: The “N” of the data-collector graphs is 4 times larger than the milestone-milestone graphs, and the milestone-milestone graph’s N is closer to what actual patient throughput should be. Why are so many data points being collected for the data-collector graphs when the global variable on which they are based is only supposed to be reset when the patient enters the room?

ed-ver-23.fsm

FlexSim HC 5.1.0
data collectorstatistics and reportscustom dashboardfiredelegateuser-defined graph
ed-ver-23.fsm (10.2 MiB)
5 |100000

Up to 12 attachments (including images) can be used with a maximum of 23.8 MiB each and 47.7 MiB total.

Matthew Gillespie avatar image
1 Like"
Matthew Gillespie answered Cliff King commented

It looks like you're over-recording data with the data collector. You have lots of duplicate values recorded:

You have the data collectors set up to record on the Custom recording event and to always record. It looks like you have FireDelegate(DELEGATE_CUSTOM); code sprinkled throughout your tracks. Whenever you call this it's recording a new value. I think you need to set some criteria so that it's not recording a new value everytime.


data.png (34.2 KiB)
· 3
5 |100000

Up to 12 attachments (including images) can be used with a maximum of 23.8 MiB each and 47.7 MiB total.

Cliff King avatar image
0 Likes"
Cliff King answered Cliff King commented

Incidentally, I learned more reasons for the difference in N (i.e. the number of data points used to calculate the box plot) between the Data Collector graph and the Milestone-to-Milestone graph.

So anyways, I dove into the model and tried to do some comparisons on a patient-by-patient basis. What I discovered is that the big difference between the two graphs is not due to the difference in timing between when the two graphs determine that the patient is roomed, but it is mostly due to the timing of when the two graphs have access to the data collected. The Data Collector graph gets the data immediately after the FireDelegate command is executed, but the Milestone-to-Milestone graph doesn't have access to the milestone data for a patient until after a patient leaves the model. Milestone times are recorded on the patient as they occur, but are not written to the global history database until the patient finishes their track and leaves the model.

If you remove the warmup period and run your model for just 1 day, you will be able to see that the two graphs are almost in sync except for one or two of the 24 periods of the 1st day. Unfortunately, the two charts will soon get out of sync as the model rolls into the second day, but things appear to be almost be in sync at this time. The only way to force the two graphs to perfectly sync, is to run a terminating model that flushes out all of the patients at some point in time. As a matter of note, you can move the FireDelegate command from the activity started trigger of the Nurse_Assess_WI where it is now, to the Process Time field, and this will eliminate any differences due to the reason I gave earlier. Then truly the only difference will be due to the lag between when the Data Collector graph receives the data point for a given patient and when the Milestone-to-Milestone graph does.

· 1
5 |100000

Up to 12 attachments (including images) can be used with a maximum of 23.8 MiB each and 47.7 MiB total.

Cliff King avatar image
0 Likes"
Cliff King answered Cliff King commented

In my attached model (ed-ver-23-ck.fsm) I made changes to the FireDelegate call in your model. I used the optional parameters of the FireDelegate command to pass in a parameter I could use in the Data Collectors to distinguish which of the three calls was being made. You call the FireDelegate command in the following three places for each of the tracks:

  1. After changing the v_Triage_TAT global variable in the Activity Started Trigger of activity 46_Conduct_Triage.
  2. After changing the v_RegToTriageStart_TAT global variable in the Activity Started Trigger of activity 46_Conduct_Triage.
  3. After changing the v_TriageEnd_to_Roomed global variable in the Activity Finished Trigger of activity 59_Nurse_Assess_WI.

I passed in the values 1,2 and 3 respectively to identify each of these three calls it was. Incidentally, I also passed in a reference to the patient for the involved object so that I could associate the involved patient's PCI with the call as well.

Please take a look at what changes I made, and let me know if you have any questions.

I should warn you that you still won't be able to exactly correlate the results of the user-defined chart and the standard milestone-milestone chart. This is because of a difference in when the patient roomed time is recorded. The "WI Patient Roomed" milestone is being recorded "Before Process Time" as defined by the Milestone Recording Event option you chose. The "Before Process Time" event occurs after the nurse is allocated and travels to the patient for the assessment. On the other hand, the custom event that triggers the data collector recording occurs when the FireDelegate command is called in the Activity Started Trigger of the assessment activity. The Activity Started Trigger fires immediately after the activity gets kicked off, before the nurse even gets allocated!

Here's a few bullet points that may help you better understand Data Collectors and the user-defined dashboard widgets:

  • The sole purpose of a Data Collector is to record data whenever a specific event occurs in the model.
  • The "Recording Event" field on the Data Collector's properties window has a list of options to choose from. You can choose to specify a regular time interval for making recordings, or choose to piggy-back on top of a standard model event (there are 11 to choose from) to make a recording, or choose the "Custom" option which expects you to use the FireDelegate() command in your model code somewhere to force a recording event.
  • Whenever the Data Collector's recording event occurs, the "Data Recording Criteria" is evaluated to determine whether any data should actually be recorded or not. I used this field to distinguish between the three different calls I mentioned earlier for the FireDelegate command in your model.
  • When the recording event passes the recording criteria, all the columns of data you've defined for the data collector will be recorded. The reason we use the term "Columns" to refer to the data values that get recorded, is because the data is stored in a 2-dimensional table for each Data Collector, where each row represents a single occurrence of an event (that passes the recording criteria anyways), and each column of the table represents a separate metric that gets recorded.
  • The User Defined dashboard widget is used to display the data collected by a single Data Collector. The widget can display one or more of the columns of data recorded by the Data Collector. You do not need (or usually want) to display all the columns of data in the same graph. It's common to use one or more of the data columns for the sole purpose of defining filters when creating the "Sample Sets" for the graph.

ed-ver-23-ck.fsm (9.2 MiB)
· 2
5 |100000

Up to 12 attachments (including images) can be used with a maximum of 23.8 MiB each and 47.7 MiB total.