Is it possible to position my State Pie's and other Statistical Charts in my 3D Model? That would be really cool in combination with Oculus Rift.
Regards Robin
Is it possible to position my State Pie's and other Statistical Charts in my 3D Model? That would be really cool in combination with Oculus Rift.
Regards Robin
Starting in FlexSim 2018 Update 1, you can unload textures from the media list using the command unloadimage().
Using that functionality, you can do what @Allister Wilson is doing using FlexScript without custom C++ code. You can use viewtofile(), unloadimage(), loadimage(), and setobjecttextureindex() to do what you want.
See the attached example model (render-stats-test.fsm).
It is on the dev list to create an easier way to render stats charts in the 3D view, but in the meantime, this method can be used.
-@phil.bobo could show me how exactly i reference the dashboard ( or the graph) required, as i have 3 graphs in 2 separate dashboards and i want to show them in the 3d view?
-the dashboard should be active?
Yes, the dashboard needs to be visible so that it renders. This method doesn't render a view that isn't visible.
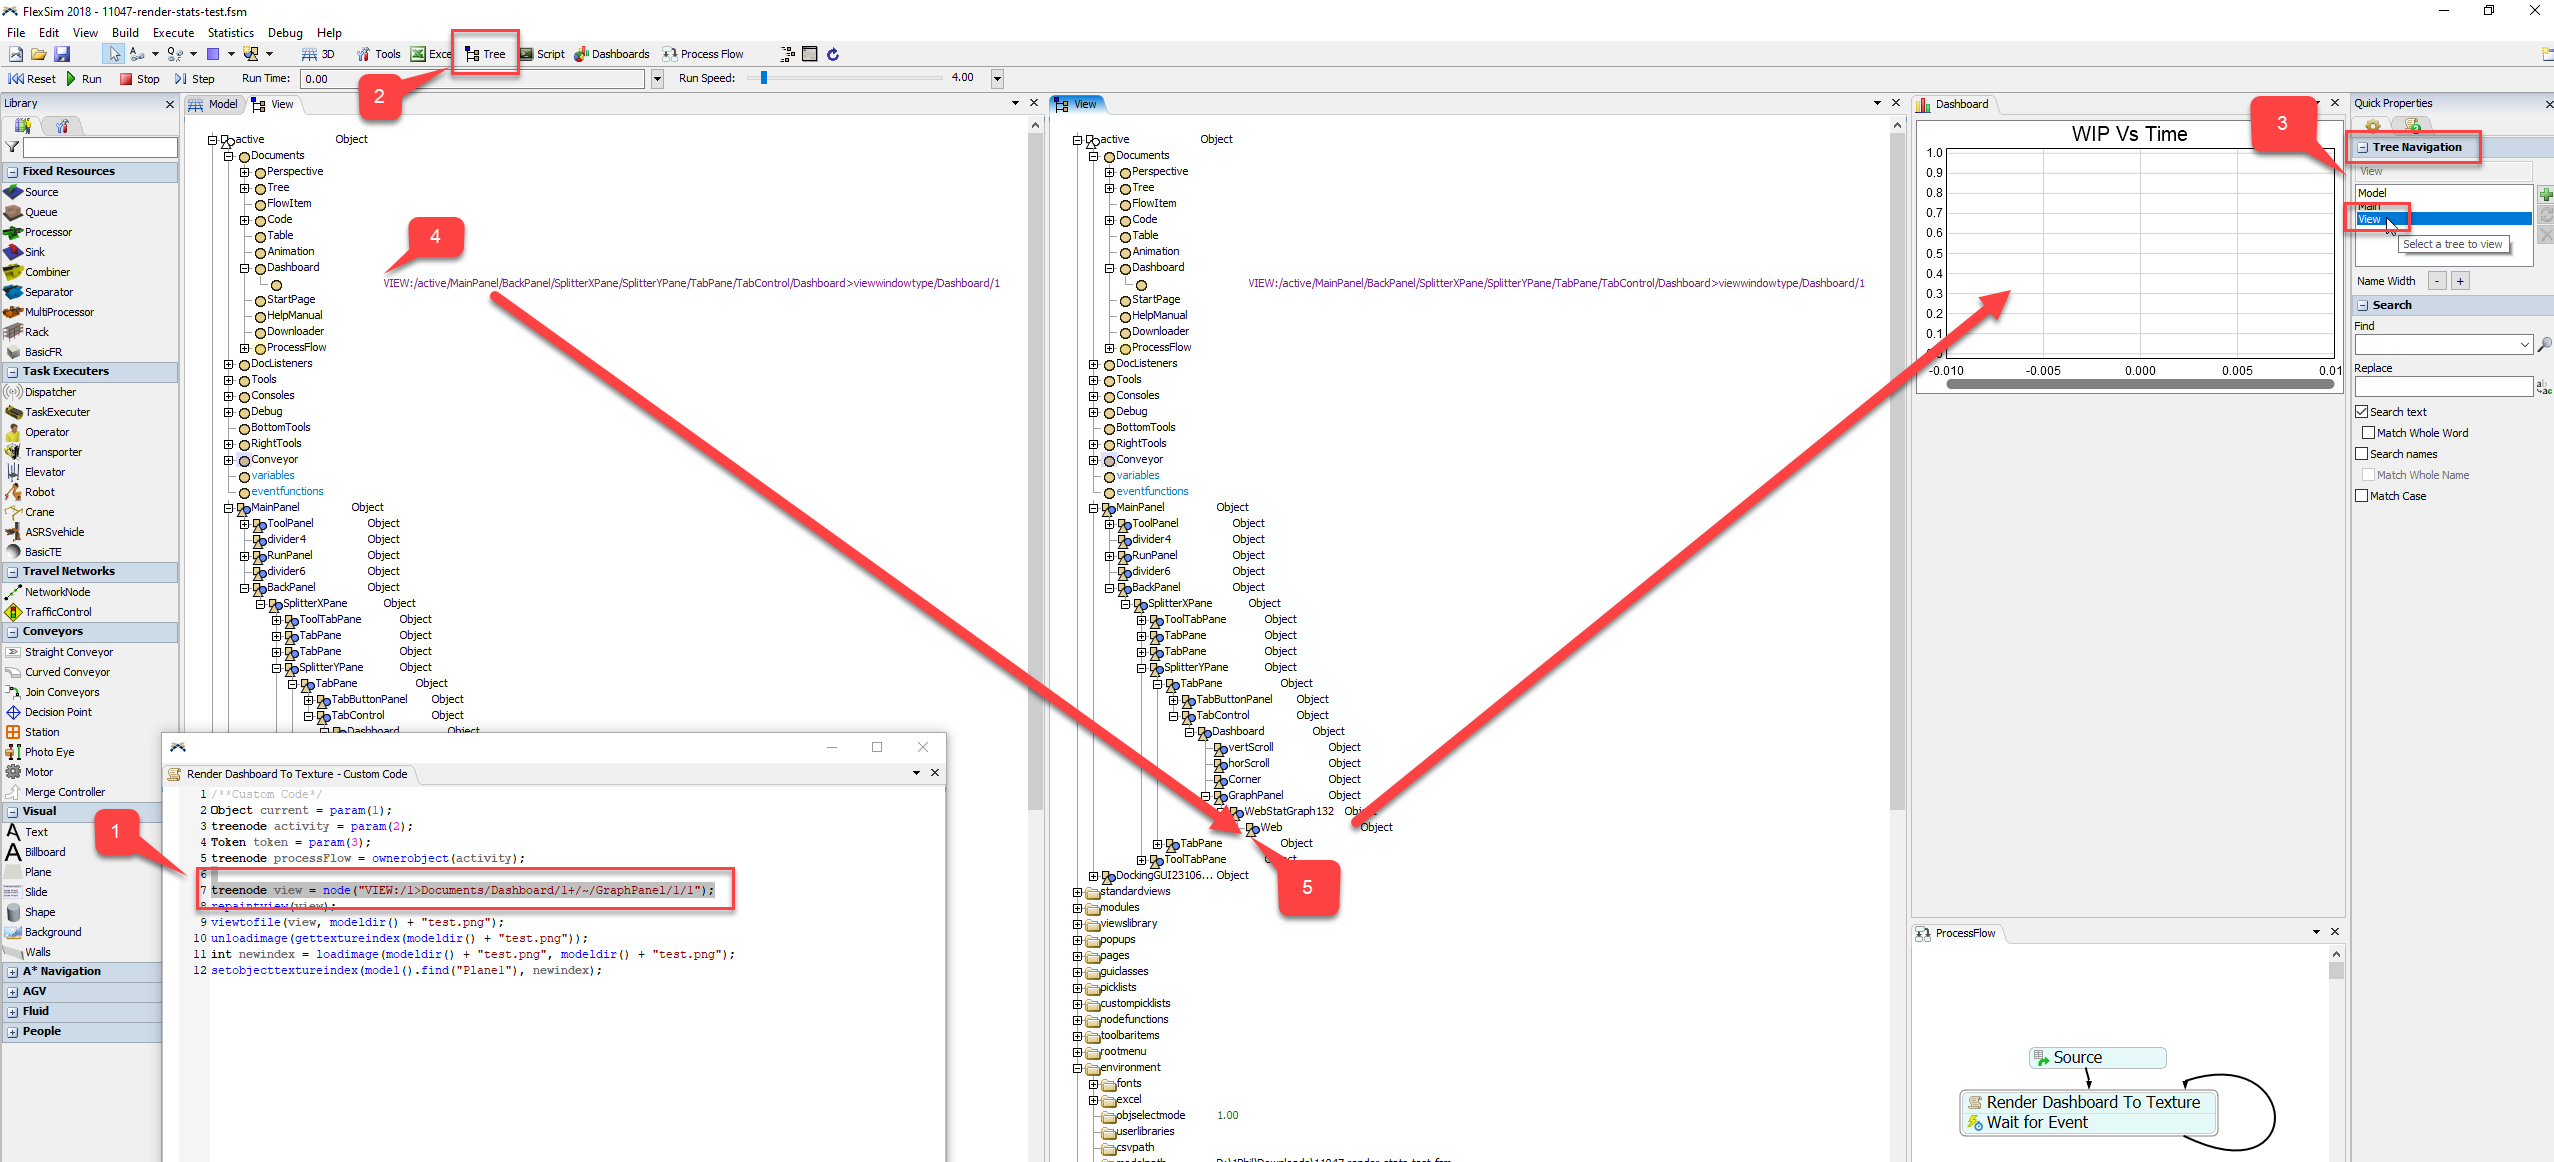
The "Render Dashboard to Texture" activity has the code that shows how to reference the dashboard charts. It references through the VIEW tree:
treenode view = node("VIEW:/1>Documents/Dashboard/1+/~/GraphPanel/1/1");
The VIEW tree keeps a list of certain opened windows. In that code, it is referencing the list of open Dashboard views, going to the first one and then referencing the first chart in that view. These references are all based on the tree structure of the views.
Hi Robin,
We recently had the same question from a user. So a colleague @Allister Wilson has built a proof of concept.
Here is a screenshot:
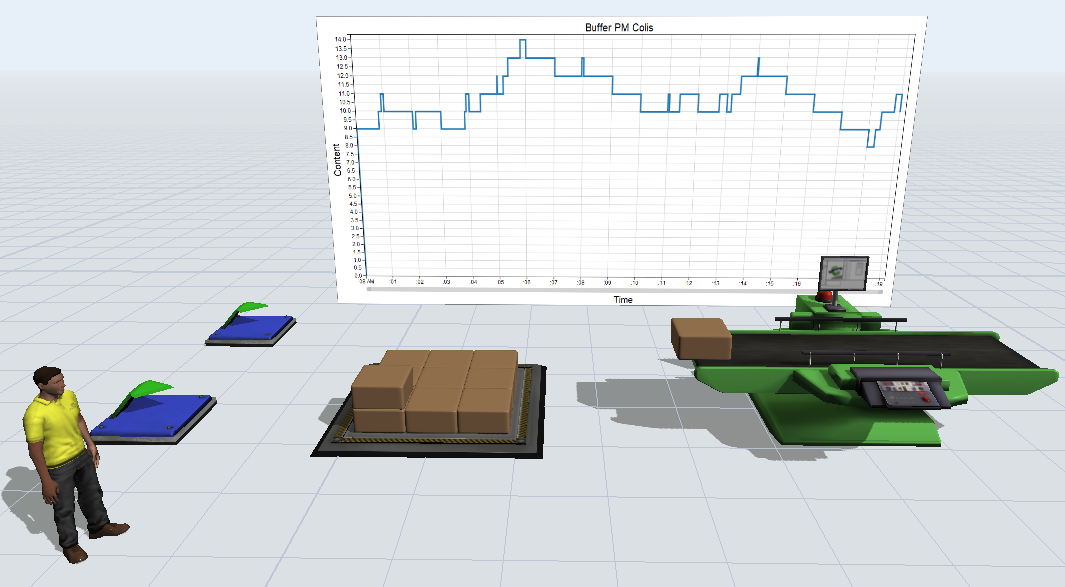
And an animated gif of visualizing this chart inside the 3D view with the Oculus Rift:
This is custom development though, there is currently no built-in feature in the software. Feel free to ask @Allister Wilson if you want to know more about this proof of concept.
It looks great! @Allister Wilson Would you please offer more detail about how to realize it? or a sample model?
The basic idea is :
It's not the best in terms of performance, and the update frequency isn't great, but it mostly works.
Thank you for your concept. I will give it a try when I have time for it. Looks good in the GIFs.
There is still the old Recorder Object in the library tree.The Recorder can show data, but the standard data structure has changed. Thus you can only show table data in the Recorder. You have to convert the State Data into the old data structure in a suitable table and you can use the table in the recorder.
createinstance(library().find("/Recorder"),model());
The code creates the old Recorder object. The States are ordered in an one column tables
Oh. Really? Thanks, @Jorg Vogel.
Does it mean all dashboard's charts to be also displayed in the Recorder object like dashboard charts?
The Recorder is a deprecated object. You can try it with my approach to transfer dashboard data to a table and use the table as the data source of the Recorder. But you get a great loss in performance and the available adjustments are limited.
3D Pie Charts, Histogram and trend Charts were possible in old version some years ago but these are changed to charts in dashboards.
But the numeric Statistics of 3D text type are possible in 3D model.
Hi Robin. I don't think this is currently possible, but I'm sure that if you were to post this as an idea it would get some upvotes.
Thanks for your advises and hints. You helped me a lot. Great forum and community by the way!
15 People are following this question.
FlexSim can help you understand and improve any system or process. Transform your existing data into accurate predictions.
FlexSim is a fully 3D simulation software environment. FlexSim can be used to simulate any process in any industry.
FlexSim®, FlexSim Healthcare™, Problem Solved.®, the FlexSim logo, the FlexSim X-mark, and the FlexSim Healthcare logo with stylized Caduceus mark are trademarks of FlexSim Software Products, Inc. All rights reserved.