question

Xu Chunqi avatar image
1 Like"
Xu Chunqi asked Isaac Litster commented

line graph:the x axis display the data I specify discretely

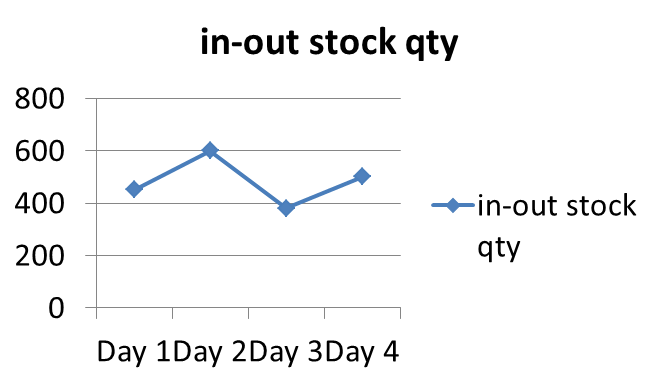
The Line Graph displays data over time when the model run by default , however I want the line graph displays data of the global table and the x axis display the data I specify discretely meanwhile as follows which means the line graph displays on GUI when the model reset. Can it come true ?Waiting for urhelp,tks!

FlexSim 17.0.1
line chart
5 |100000

Up to 12 attachments (including images) can be used with a maximum of 23.8 MiB each and 47.7 MiB total.

1 Answer

·
Matt Long avatar image
0 Likes"
Matt Long answered Isaac Litster commented

Have you tried using the Custom Chart? In the Custom Chart you can create an association with a table and then implement your own code/logic for defining how the data is displayed. There are some preset options you can choose and customize if necessary. You can also change the display type to be a table, bar chart or line graph.

· 2
5 |100000

Up to 12 attachments (including images) can be used with a maximum of 23.8 MiB each and 47.7 MiB total.

Xu Chunqi avatar image Xu Chunqi commented ·

Thanks for ur attention. The Custom Chart cannot meet my need.I want the x axis display the data discretely and the line graph displays on GUI when the model reset instead of model run.

0 Likes 0 ·
Isaac Litster avatar image Isaac Litster Xu Chunqi commented ·

@Shiny Xu

Sorry to get back to you late. Do you still need help with your graph?

0 Likes 0 ·

Write an Answer

Hint: Notify or tag a user in this post by typing @username.

Up to 12 attachments (including images) can be used with a maximum of 23.8 MiB each and 47.7 MiB total.