question

elizabeth.l avatar image
0 Likes"
elizabeth.l asked Logan Gold commented

Content vs Time dashboard for list with partitions

content-vs-time-dashboard-for-list-with-partitions.fsm

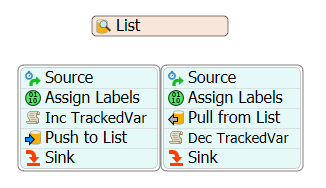
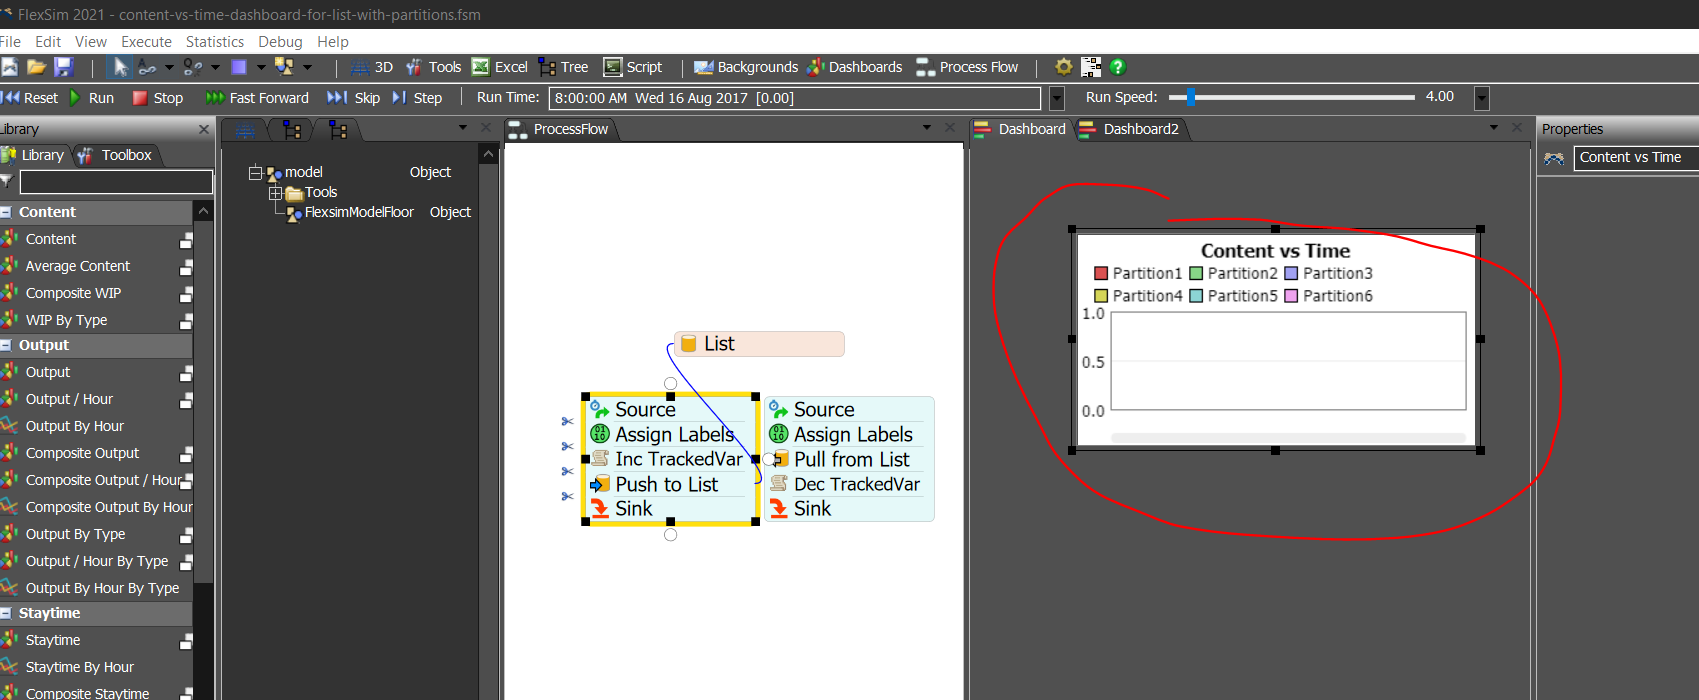
I'd like to have a dashboard that shows all tokens being pushed onto a partition over time.

This includes tokens that are immediately pulled after a push (pulled at the same simulation time or before a push). In the attached model, the pull request occurs before the push and the dashboard doesn't show any content being added to the list. I tried having the pull and push occur at the same simulation time and that didn't work either.

It works fine if the pull request comes after the push.

Choose One
Choose One
list partition dashboard
5 |100000

Up to 12 attachments (including images) can be used with a maximum of 23.8 MiB each and 47.7 MiB total.

1 Answer

Jacob Gillespie avatar image
0 Likes"
Jacob Gillespie answered Logan Gold commented

In the attached model I made a tracked variable for each partition.

I then increment the tracked variable before pushing to the list and decrement after pulling.

This will get you the 0 time changes.

content-vs-time-dashboard-for-list-with-partitions.fsm


· 2
5 |100000

Up to 12 attachments (including images) can be used with a maximum of 23.8 MiB each and 47.7 MiB total.

fiz avatar image fiz commented ·

Hi Jacob, how did you add that to your dashboard, i tried finding it in the libarary on the left side but couldnt find any.

1722911947100.png

0 Likes 0 ·
1722911947100.png (165.1 KiB)
Logan Gold avatar image Logan Gold ♦♦ fiz commented ·

Hi @fiz, the graph in Jacob's model is a Tracked Variable Vs Time chart, as a Line Chart. You can find it in the Dashboard's Library in the General section:

dashboardlibrary-trackedvariable.png

0 Likes 0 ·