I am trying to set a tracked variable in the OnExit trigger of a processor so that it changes the label value of that processor. When I use the dropper on the Tracked Variable vs Time dashboard to select that label value, it automatically adds a space in between the object name "Processor1" and the tracked variable "labelname". This is causing problems when there are many objects and many tracked variables because when I export the dashboards to .csv, the objects are indistinguishable from each other. Any ideas how to concatenate the object name and the tracked variable/label name?
How do I remove the space between object name and tracked variable name?
Choose One
Unfortunately that chart doesn't support renaming and as it's a legacy chart, there are no plans to update it.
There isn't an exact template that will do what the Tracked Variable vs Time chart will do, but it's not too hard to customize the new charts to get what you want. I've attached a simple model showing an example of what you're trying to do.
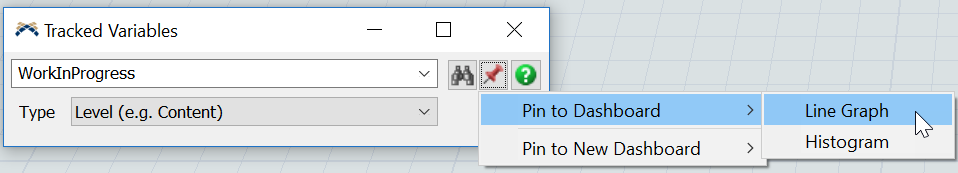
The easiest way to get started is to go to the Toolbox, double click on a Tracked Variable to open its properties window and then use the Pin button to pin that tracked variable to a dashboard as a Line Graph.
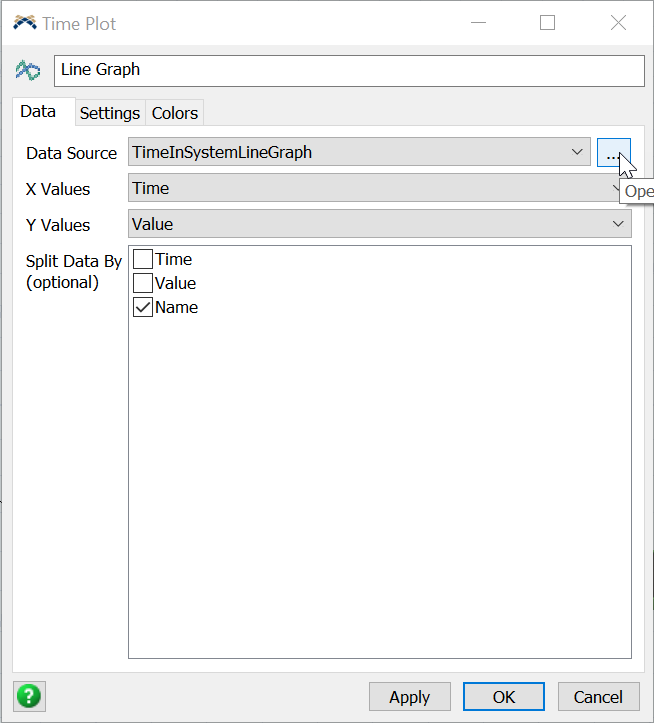
This will give you a starting point by creating the Dashboard Chart as well as a Statistics Collector that will gather the data that will be displayed on the chart. If you double click on the chart in the dashboard to open it's properties window, you'll see that there is a Data Source defined. Click on the ... button to the right of this to open the Statistics Collector properties.
The Statistics Collector will have a listener to the On Change of the Tracked Variable that you pinned. You can use the Sampler to change the Object to point to your label.
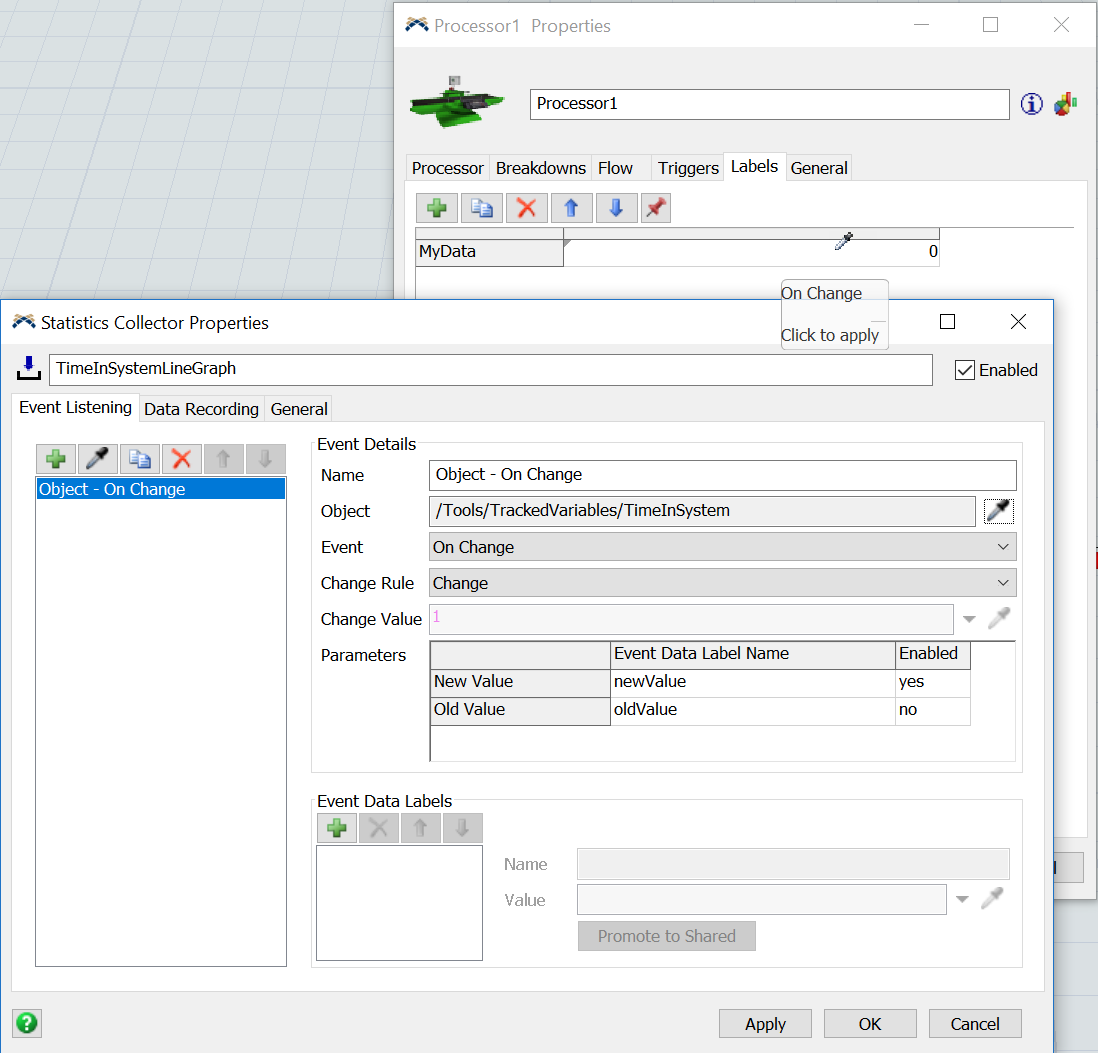
You'll need to update the table under the Event Data Label Name to say NewValue instead of newValue so you don't get errors when it tries to grab the data for the value column.
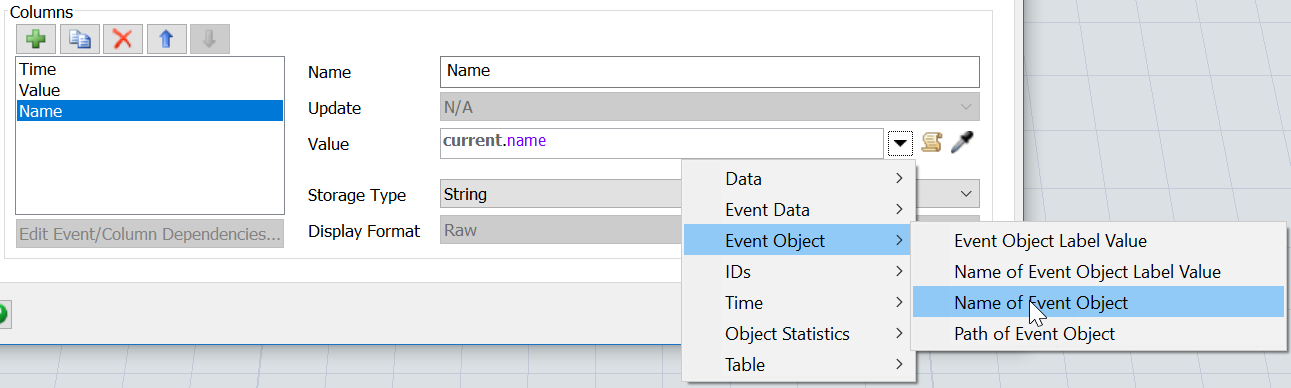
Next, if you go to the Data Recording tab, you can add a Column of data that will be the name of your label (or however you want to name it). You can click on the drop down button next to the Value field and select Event Object > Name of Event Object. This will place the code current.name into the Value field where current is the tracked variable label.
The last step is to tell the chart to split the data by our Name column. Reset the model to ensure the statistics collector has updated its columns, then double click on the Line Graph to open its properties. Check the Name box under Split Data By.
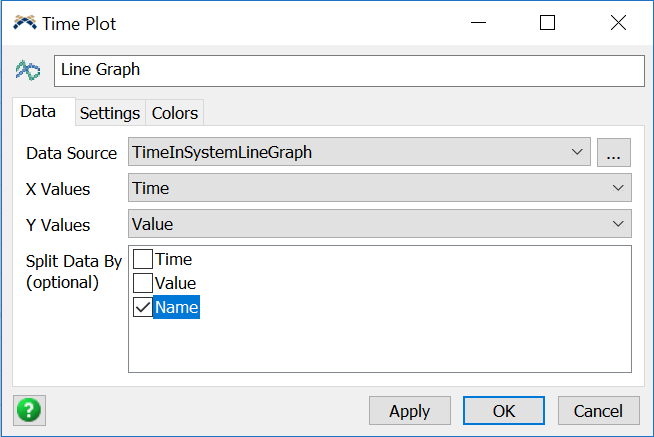
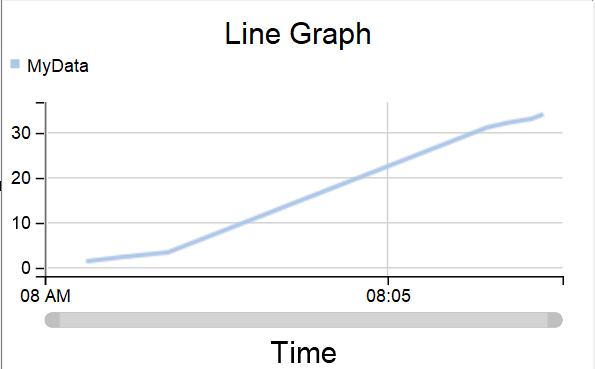
Hit OK and then reset and run your model. You should see the name of your label displayed in the chart.
If you want to change the look of the chart, you can go to the Settings tab and set the Draw Style to Line or Stair Step.
It's a few more steps, but you get complete flexibility with how your chart looks, what data is displayed, etc.
7 People are following this question.
