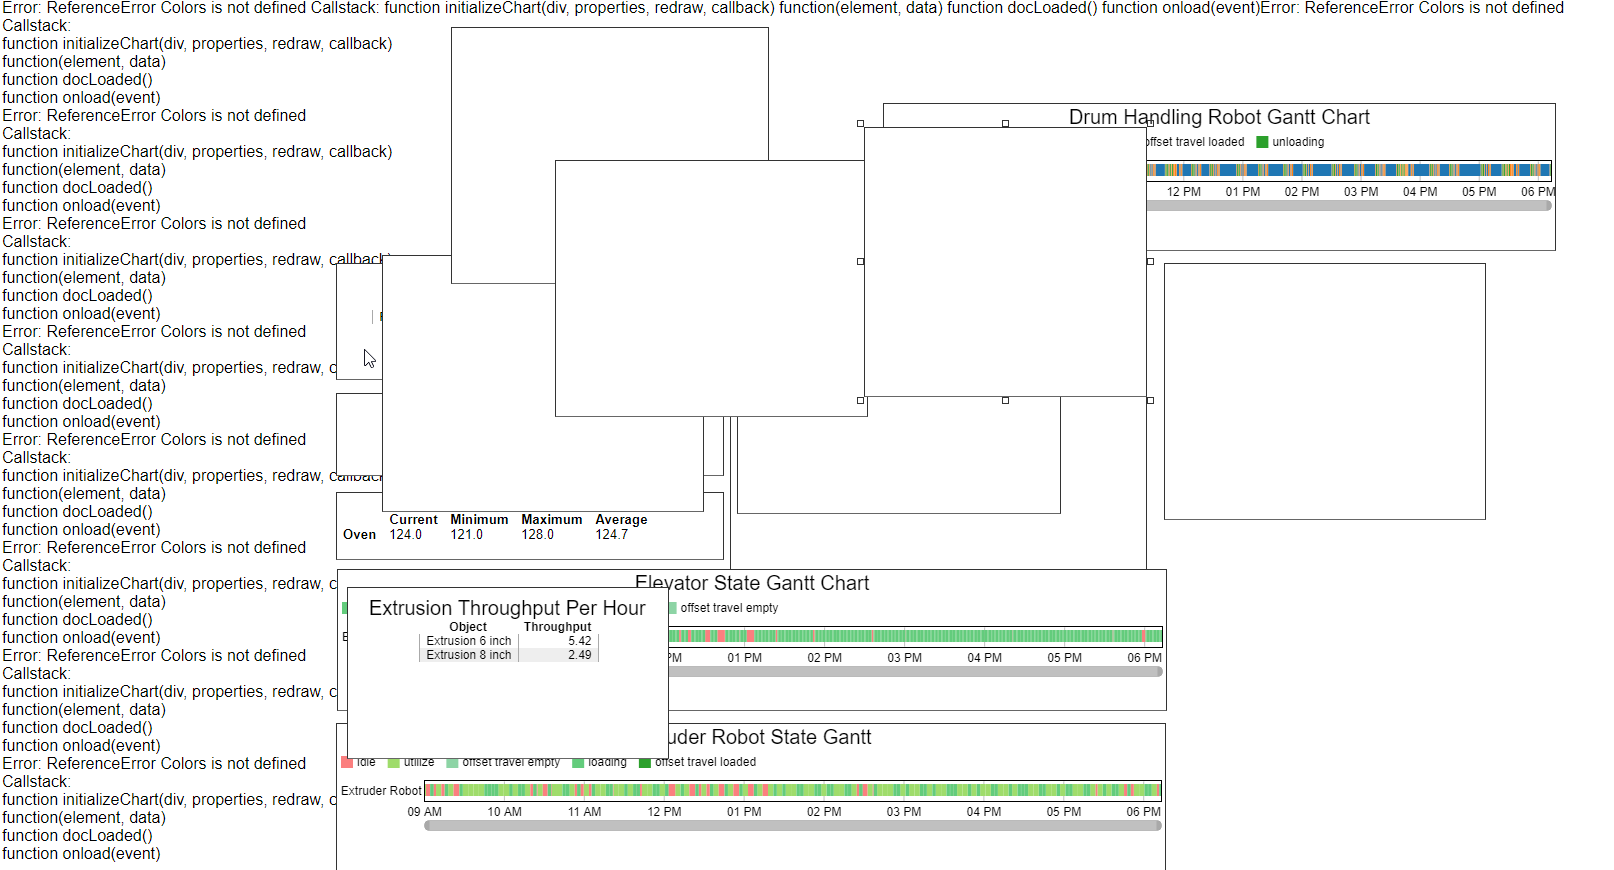
I've attached a screenshot of my issue. I recently upgraded to Flexsim 2018 Update 2 and my dashboard HTML export doesn't show any of the state charts anymore. In addition, there is this weird error code going on in the background. I've moved all the blank charts aside so you can see the error code. Any idea what could be causing this? PNG export works fine but it doesn't grab the whole dashboard set and doesn't provide the interactivity of the HTML interface.
I have seen similar errors before, although I am not sure what causes them. In general, something seems to go wrong in getting the colors for one of the charts. Once one chart goes wrong, the later charts don't even try to export.
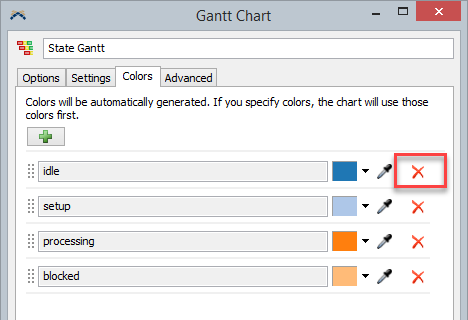
The solution is to find a Gantt chart that doesn't export (possibly a State Gantt), and delete all the colors from the colors list. The chart will choose new colors automatically. The issue is that somehow, the tree structure of the colors gets corrupted, and deleting all the colors resets that structure.
Hmm...it seems that the text statistics and gantt charts are the only visuals showing up anyway. I tried your suggestion as well but no luck. Any other propositions?
12 People are following this question.