question

pc neo avatar image
0 Likes"
pc neo asked pc neo commented

FloWorks chart display 0 at end of runtime

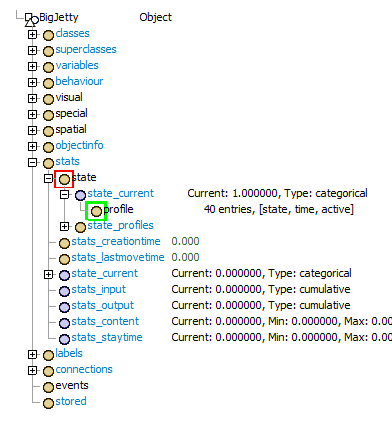
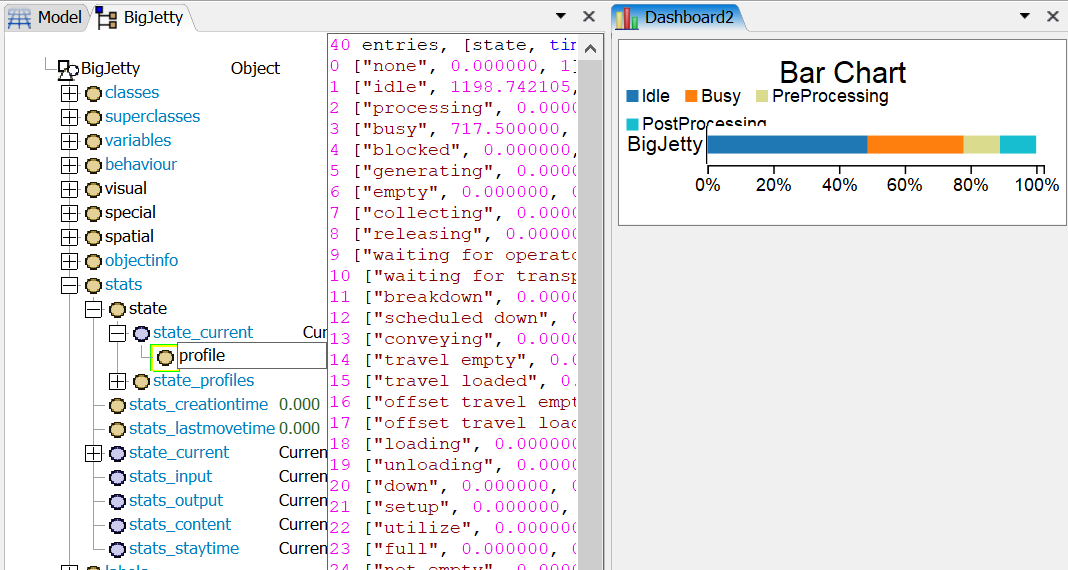
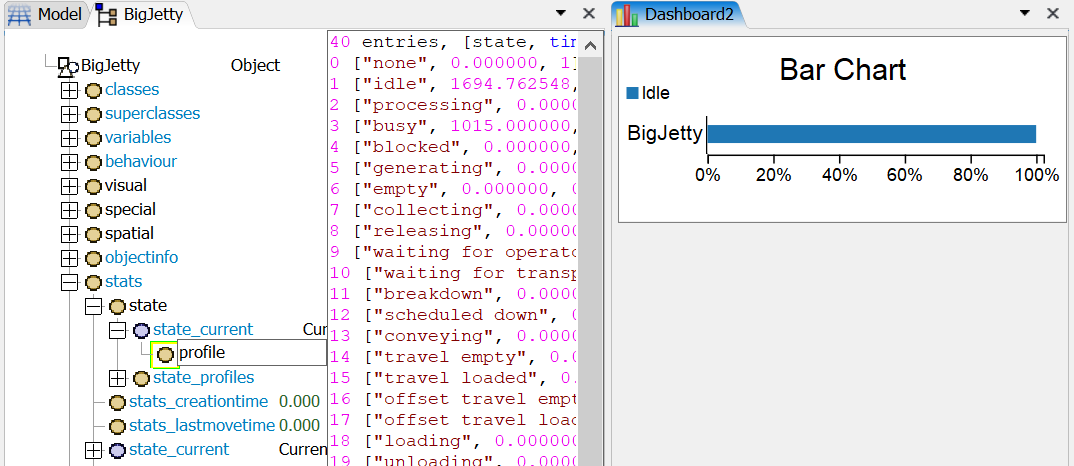
I've used the "pin" on the berth object to display the state bar chart of the berth. During the run the chart was updated during-run.png. However, when the stop time is reached, the chart displayed 0 as its stats. refer at-stop-time.png.

I could see the statistics value collected, how can I display it on the chart?

Attached is a sample model with the chart.sample-model-1.fsm

FlexSim 18.2.2
FloWorkschartschart templates
at-stop-time.png (53.9 KiB)
during-run.png (65.2 KiB)
sample-model-1.fsm (94.2 KiB)
5 |100000

Up to 12 attachments (including images) can be used with a maximum of 23.8 MiB each and 47.7 MiB total.

1 Answer

·
Patrick Zweekhorst avatar image
0 Likes"
Patrick Zweekhorst answered pc neo commented

@Hi @pc neo,

There is a small bug in collecting the state stats on the loadingpoint. This will be fixed in the next release. You can solve this for now by deleting the state node in the tree (see attachment). I do not exactly know why this fixes the problem, but at least you will be able to see the correct dashboards.

Patrick


state.png (13.0 KiB)
· 1
5 |100000

Up to 12 attachments (including images) can be used with a maximum of 23.8 MiB each and 47.7 MiB total.

pc neo avatar image pc neo commented ·

thank you! That works! :)

0 Likes 0 ·

Write an Answer

Hint: Notify or tag a user in this post by typing @username.

Up to 12 attachments (including images) can be used with a maximum of 23.8 MiB each and 47.7 MiB total.