question

Larbi F avatar image
0 Likes"
Larbi F asked tannerp commented

FlexSim Experimenter

power-unit-production-model.fsm

Hello all,

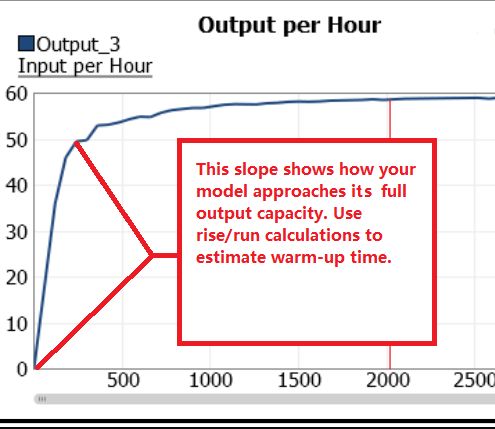
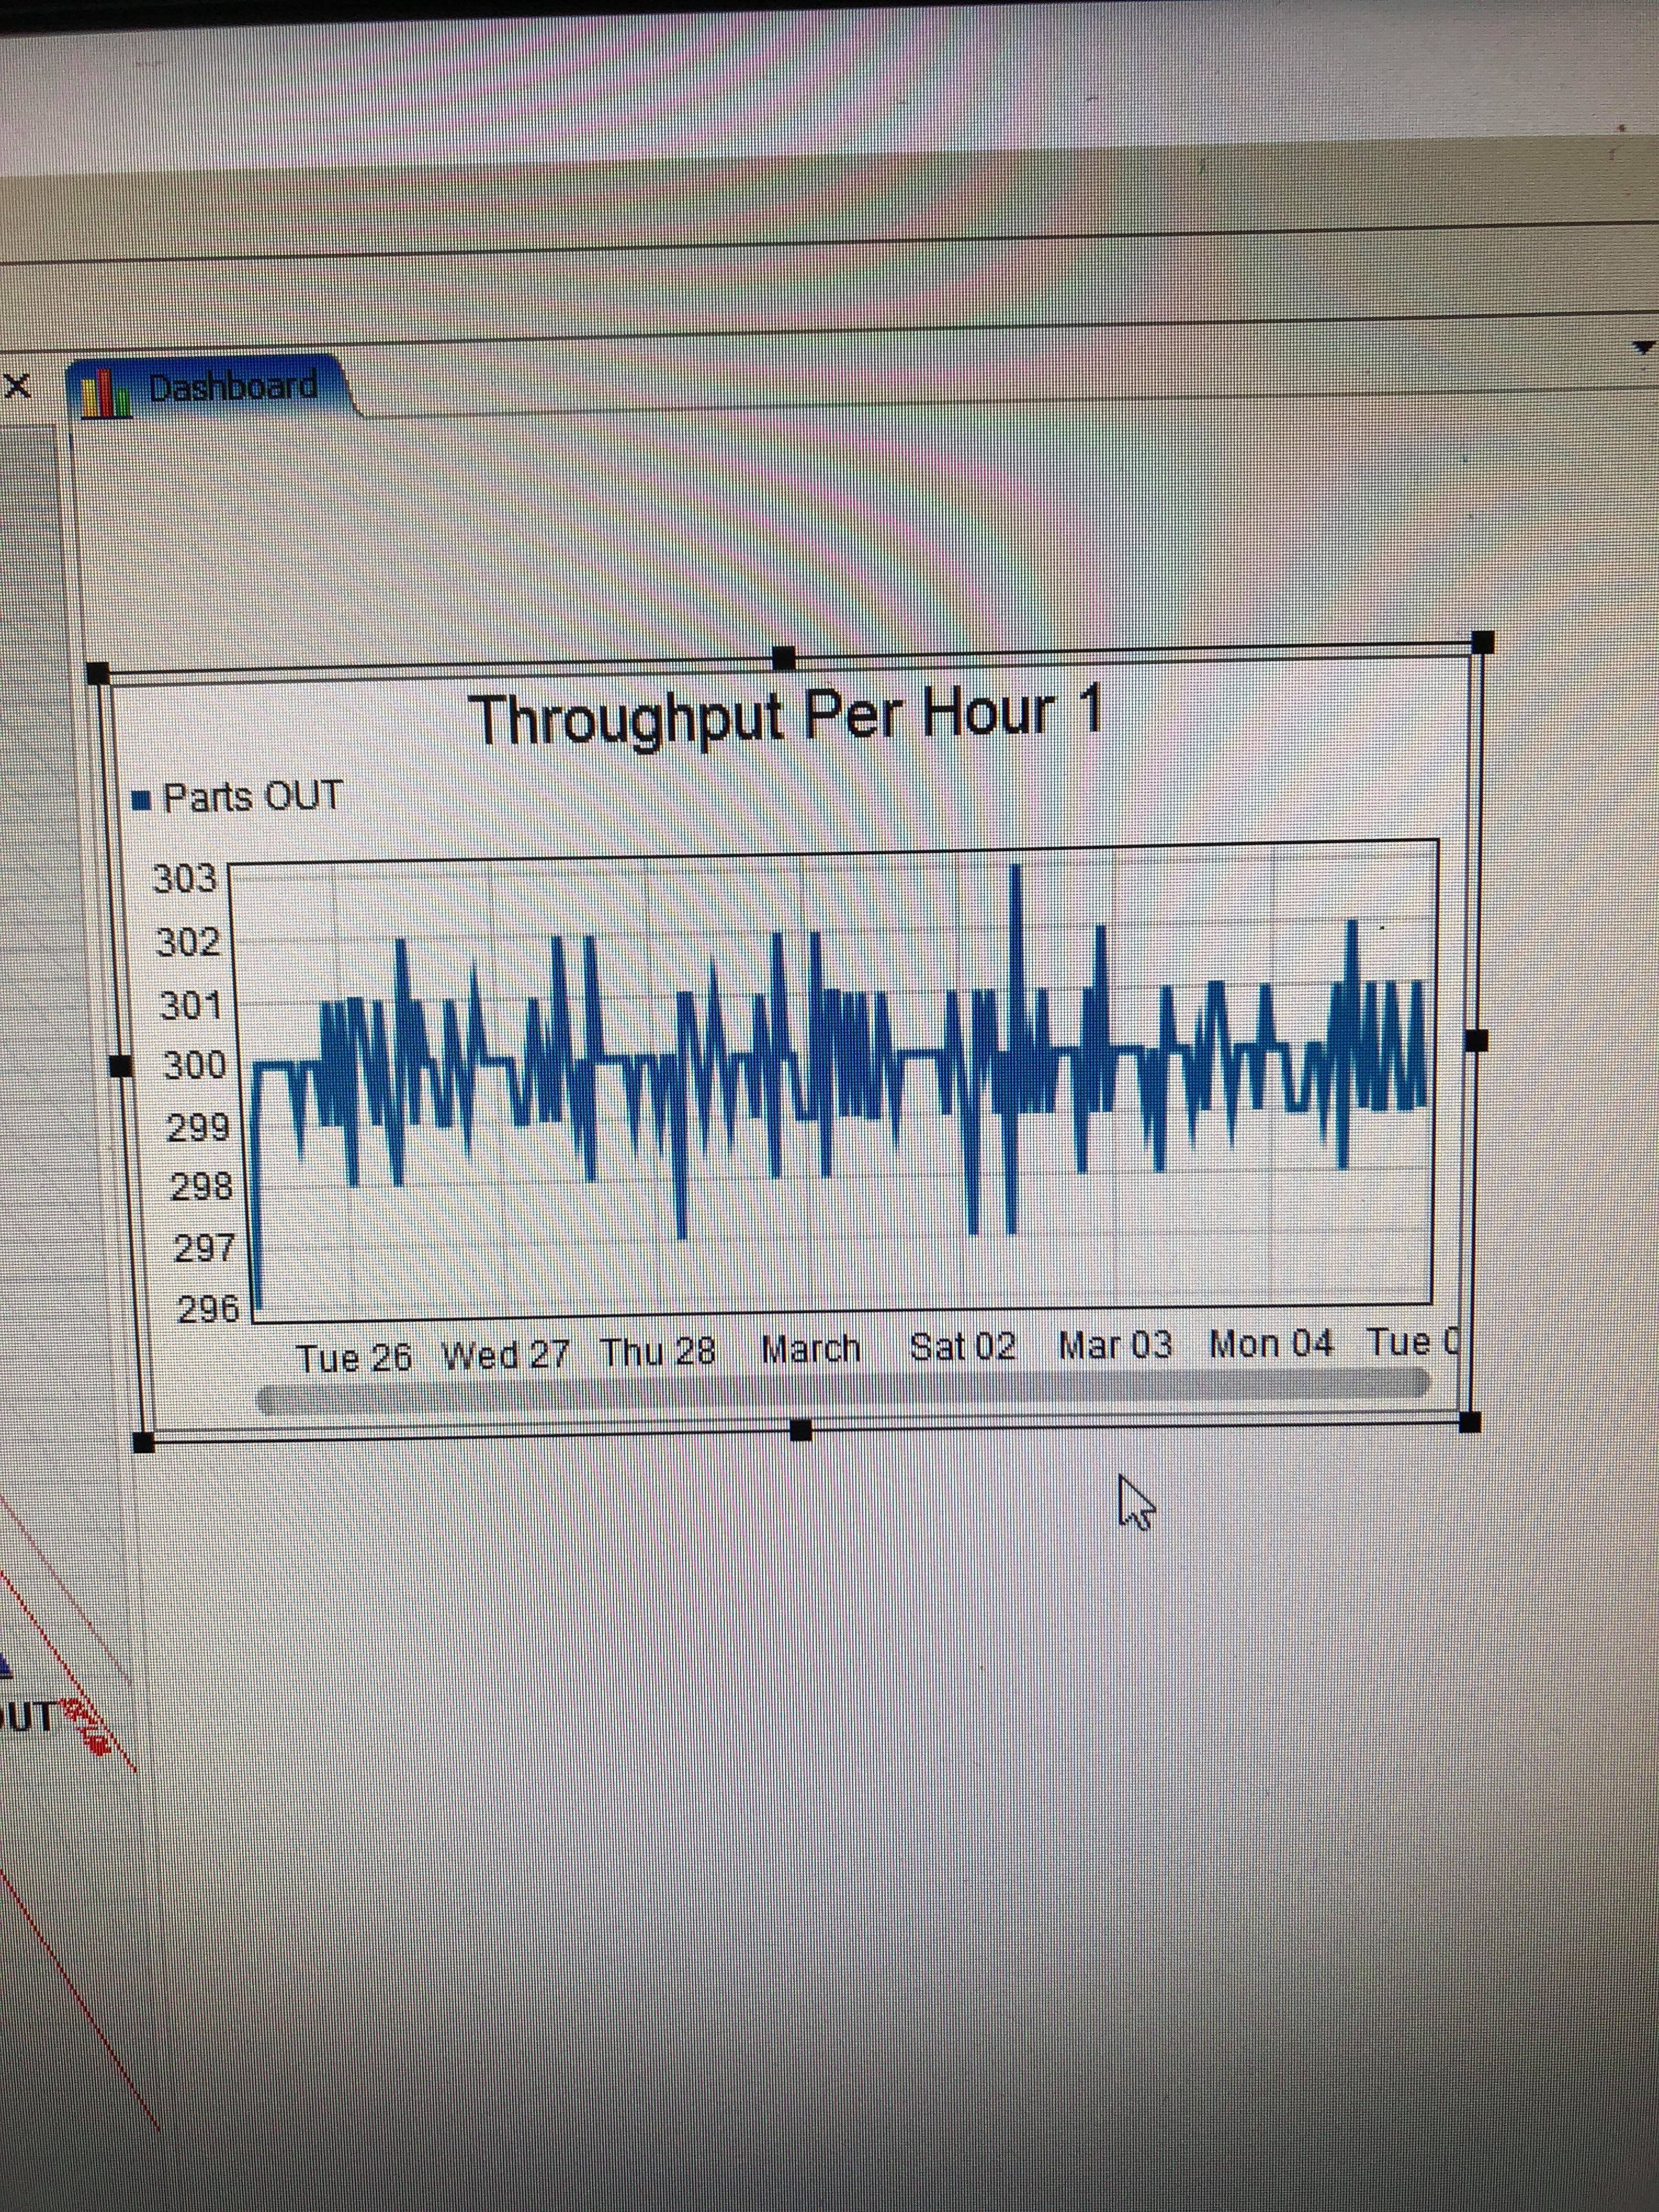
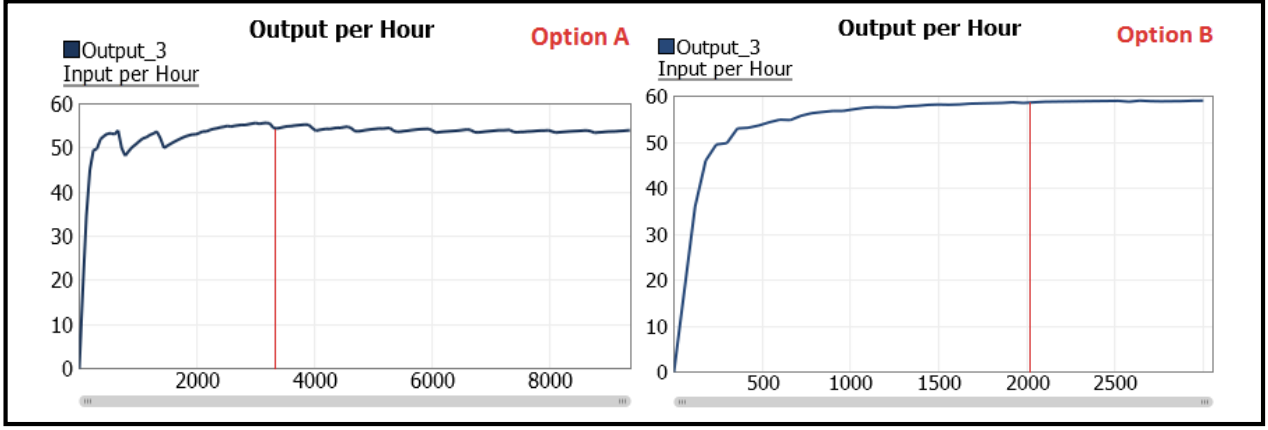
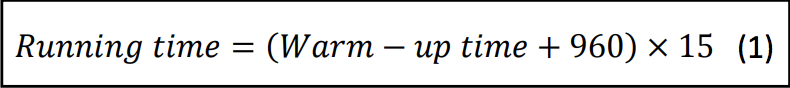
I had this model to build (attached below). I need to conduct experiments in order to ultimately optimise the whole system. However, I am a beginner in Flexsim and would like your help to first calculate the warm-up time: I tried plotting an output per hour graph for the sink but it keeps on oscillating. Then I need to calculate the simulation run length which I do not know how to derive.

Also, if you could please help me understand replications in a simulation context as I didn't get the hang of it.

Thank you very much in advance.

FlexSim 18.2.3
experimentersimulationoptimizationreplicationswarm up time
· 2
5 |100000

Up to 12 attachments (including images) can be used with a maximum of 23.8 MiB each and 47.7 MiB total.

1 Answer

Sam Stubbs avatar image
1 Like"
Sam Stubbs answered tannerp commented

The warmup time is usually used to help your system get all the way set up. For example, do stations at the end of the line have to wait until parts start arriving? If that's the case (and you aren't interesting in measuring those start up time periods) then set your warmup time to be whenever the model is starting to run at the capacity you want to measure. There's no specific calculation for you, that's just something you'll have to determine. The same goes for end time, that's just for you to determine. What window of measurment are you looking to simulate? Do you want the data for how your system operates in a day, a week? a month? etc. That's something for you to determine, based on what you're looking for.

Replications just mean how many times the model repeats itself. (Because most models use random distributions for time, arrivals, etc.) The replications show multiple repeats of this so you can see what the numbers look like over many iterations.

I'll look at your model, but the oscillations in the data doesn't necessarily mean it's not working. You're looking at throughput over time. So this graph is showing that. At X time you had Y throughput which could fluctuate from moment to moment. As the time moves outward, you'll see that the line may have larger curves up or down depending on your system.

· 4
5 |100000

Up to 12 attachments (including images) can be used with a maximum of 23.8 MiB each and 47.7 MiB total.