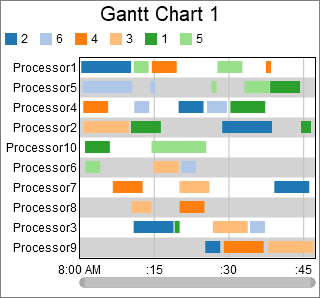
Hello ,everyone!I am glad that the FlexSim community could offer us much help in simulation .This passage is asking for help about a Production Scheduling Model .I would like to get gantt Chart to show the result like this to show the type of the item,machine ,and the process time in FlexSim .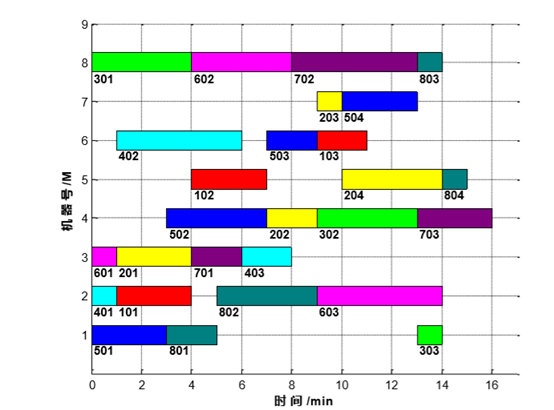
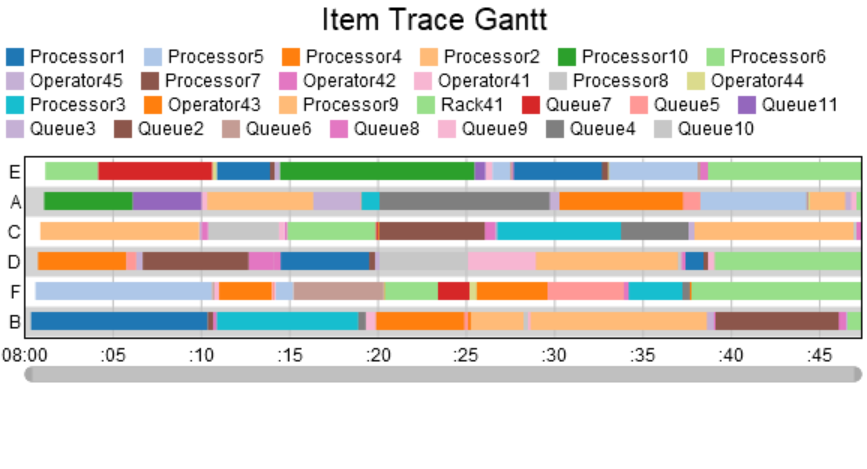
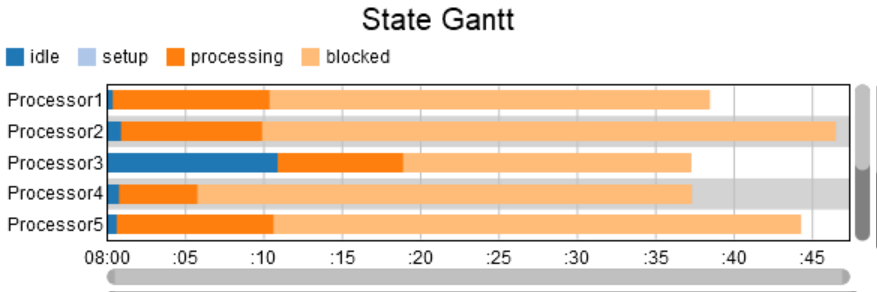
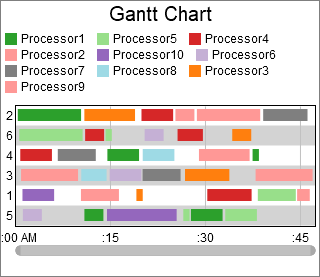
I have tried Gantt in FlexSim ,but what I got is like this .It could not show the type of item that machine processed.
As you can see from the picture ,the Item Trace Gantt is so dazzling that we could recognize which machine the Item was processed.
Is there a way to combine the two above charts to show the machine corresponding to the item Type? I am confused about how to get Gantt Chart like the first picture The model has been attached .
Thank you much for your attention .
