Hi,
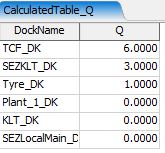
I have a Calculated Table of Queue of the Docks, this will keep on change in the model run
How can i plot the below shown Calculated Table into a Q Vs Time graph
You can add a time plot chart and select the calculated table as the data source.
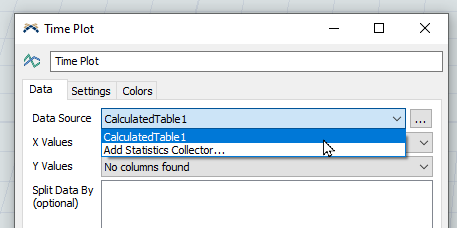
You will need time data in your table as well.
how can i get Time in X Axis in correct Format? calculatedtable.fsm
Hi @Ameen M Shabeer,
I think the best way to accomplish this is using a stats collector. I am running short on time right now, so I will attach the example model and detail an answer on Monday.
Hi @Benjamin W2
the attached model is just for a reference to manipulate the Calculated table.
in actual we didn't have process flow activities to attach Statscollector.
15 People are following this question.
FlexSim can help you understand and improve any system or process. Transform your existing data into accurate predictions.
FlexSim is a fully 3D simulation software environment. FlexSim can be used to simulate any process in any industry.
FlexSim®, FlexSim Healthcare™, Problem Solved.®, the FlexSim logo, the FlexSim X-mark, and the FlexSim Healthcare logo with stylized Caduceus mark are trademarks of FlexSim Software Products, Inc. All rights reserved.