question

Andres Pallaro avatar image
0 Likes"
Andres Pallaro asked Jordan Johnson commented

How to create a Dashboard Table with filtered information from a List?

Hi,

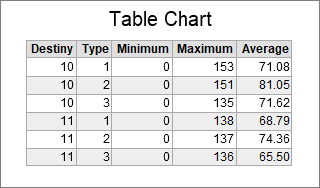
I have elements on a list and I would like to plot a summary on a table with fields such as item Type and Destiny so i can then filter data to obtain statistics like the minimum, maximum and average items in the list (as shown in the "Summary table" of the image).

How can i do this? I know a Calculated table may be the answer but I don't know if it its better with a statistics collector.

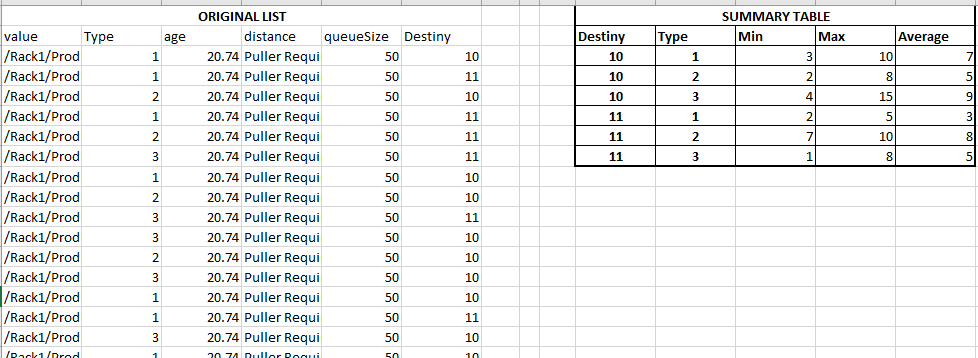
I attach an example model for better understanding.

example-list-to-table-answers.fsm

FlexSim 20.1.0
dashboardslistcalculated table
5 |100000

Up to 12 attachments (including images) can be used with a maximum of 23.8 MiB each and 47.7 MiB total.

1 Answer

·
Jordan Johnson avatar image
1 Like"
Jordan Johnson answered Jordan Johnson commented

A Calculated Table doesn't work to well here, because the average needs to be time weighted. A Statistics Collector is the correct tool for this case.

I made a summary table like you wanted:

example-list-to-table-answers-modified.fsm

In the next release of the beta, there will be an Additional Tools tutorial (task 2.7) that covers most of what I did here.

Basically, this stats collector works by listening to when items are pushed and pulled from the list. When they are pushed and pulled, the stats collector figures out which row to update. Since there is one row per combination of Destiny and Type, that is the Row Value. Each row also has a row label called Content that is a Tracked Variable. Tracked Variables are nice because as you set them, they calculate the min, max and average for you. So as items are pushed and pulled, I increment a tracked variable on each row, and show the min, max, and average in the table.

Note that the minimum is zero. Unless you use a warmup time, the minimum is likely to always be zero. Also, since there is no flow off the list, the max is the same as the current value.

You may also be interested to know that you could listen to the On Slot Entry and On Slot Exit of the Storage System. Since your list seems to only be used for stats, dispense with the list and just use the Storage System events, and get the same table.


· 2
5 |100000

Up to 12 attachments (including images) can be used with a maximum of 23.8 MiB each and 47.7 MiB total.

Andres Pallaro avatar image Andres Pallaro commented ·

Thanks Jordan, this is what I was searching for but I have one more question.

How can it be done on the 20.0.2 version? The Statistics collector window does not have the same properties.

0 Likes 0 ·
Jordan Johnson avatar image Jordan Johnson ♦♦ Andres Pallaro commented ·

In version 20.0, you would need to create a Process Flow to manage the tracked variables. It is much more complicated. If you still need this information, please ask it as a new question.

0 Likes 0 ·

Write an Answer

Hint: Notify or tag a user in this post by typing @username.

Up to 12 attachments (including images) can be used with a maximum of 23.8 MiB each and 47.7 MiB total.