question

Mason W avatar image
0 Likes"
Mason W asked Jordan Johnson commented

Custom Statistic Help

Hi all,

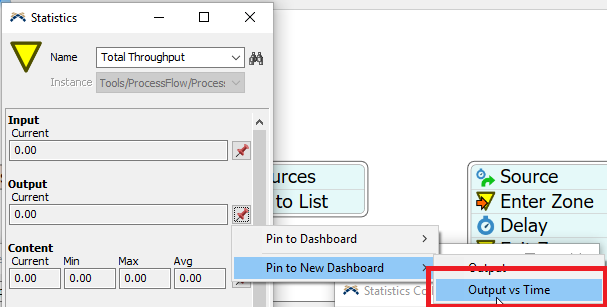
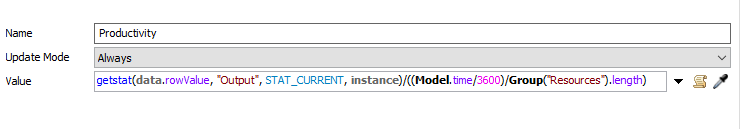
I'm trying to create a custom statistic that I can display on a dashboard that shows productivity/man hour. I've created a simple example attached that will hopefully be clear. The equation I'm trying to create would be "Total Throughput / ((Model Time / 3,600) / Number of Resources)". I've got a Zone collecting the total throughput and the number of resources can be found in a Group. I am just unfamiliar on how to create a custom statistic that collects a metric that is an equation.

Is this possible? The goal of this statistic would be to be able to track it visually on a dashboard where you can see the Throughput per Man Hour at any given time.

Any help is greatly appreciated!

-Mason

sample.fsm

FlexSim 19.1.1
statistics collectordashboard display
sample.fsm (31.3 KiB)
5 |100000

Up to 12 attachments (including images) can be used with a maximum of 23.8 MiB each and 47.7 MiB total.

1 Answer

·
tannerp avatar image
0 Likes"
tannerp answered Jordan Johnson commented

Hi @Mason W,

Have you used the Statistics Collector tool? I threw together a quick equation (probably not the prettiest way to do this) in a table using the Stats Collector. Let me know if this is what you're looking for: sample-1.fsm

The Stats Collector allows you to listen to a bunch of events, put those events into a table, and then output them in a variety of ways.


sample-1.fsm (240.7 KiB)
· 4
5 |100000

Up to 12 attachments (including images) can be used with a maximum of 23.8 MiB each and 47.7 MiB total.

Mason W avatar image Mason W commented ·

@Tanner Poulton this is right in line with what I'm looking for! I've tried to utilize statistics collectors, but haven't quite been able to wrap my head around it. This is certainly helpful. As for the dashboard, is there a way to make this a time plot graph to see how productivity has changed over time? Would I need to add an additional column in the statistics collector that looks at time of some sort?

0 Likes 0 ·
tannerp avatar image tannerp Mason W commented ·

The Statistics Collector has a pretty steep learning curve, but it's worth it. I am still learning it myself, actually.

I would just start with a basic Output vs. Time graph (from Zone statistics; shown below) and then add the Productivity calculation as another column to be tracked.

Model: sample-3.fsm

0 Likes 0 ·
sample-3.fsm (35.3 KiB)
Mason W avatar image Mason W tannerp commented ·

@Tanner Poulton appreciate all the help. This is exactly what I'm looking for. I'll continue to work on Statistics Collectors, but overall I feel the User Guide is lacking a bit in detail and clarity in regards to them. Just as an FYI from a user.

Thanks again!

0 Likes 0 ·
Show more comments

Write an Answer

Hint: Notify or tag a user in this post by typing @username.

Up to 12 attachments (including images) can be used with a maximum of 23.8 MiB each and 47.7 MiB total.