Hi !
I have a Tracked Variable and I would like to know how can I graph in the same chart different data of the Tracked Variable (Current, minimum, maximum, average, entries, etc)
Hi !
I have a Tracked Variable and I would like to know how can I graph in the same chart different data of the Tracked Variable (Current, minimum, maximum, average, entries, etc)
Are you using the tracked variable to measure the content of items in a process or set of processes? If so it may be easier to create a process flow Zone to "wrap" to get the statistics you are looking for.
You can add a Statistics Collector to get this information from the Tracked Variable to display on a chart in the Dashboard. See the attached model. tracked-variable-data.fsm
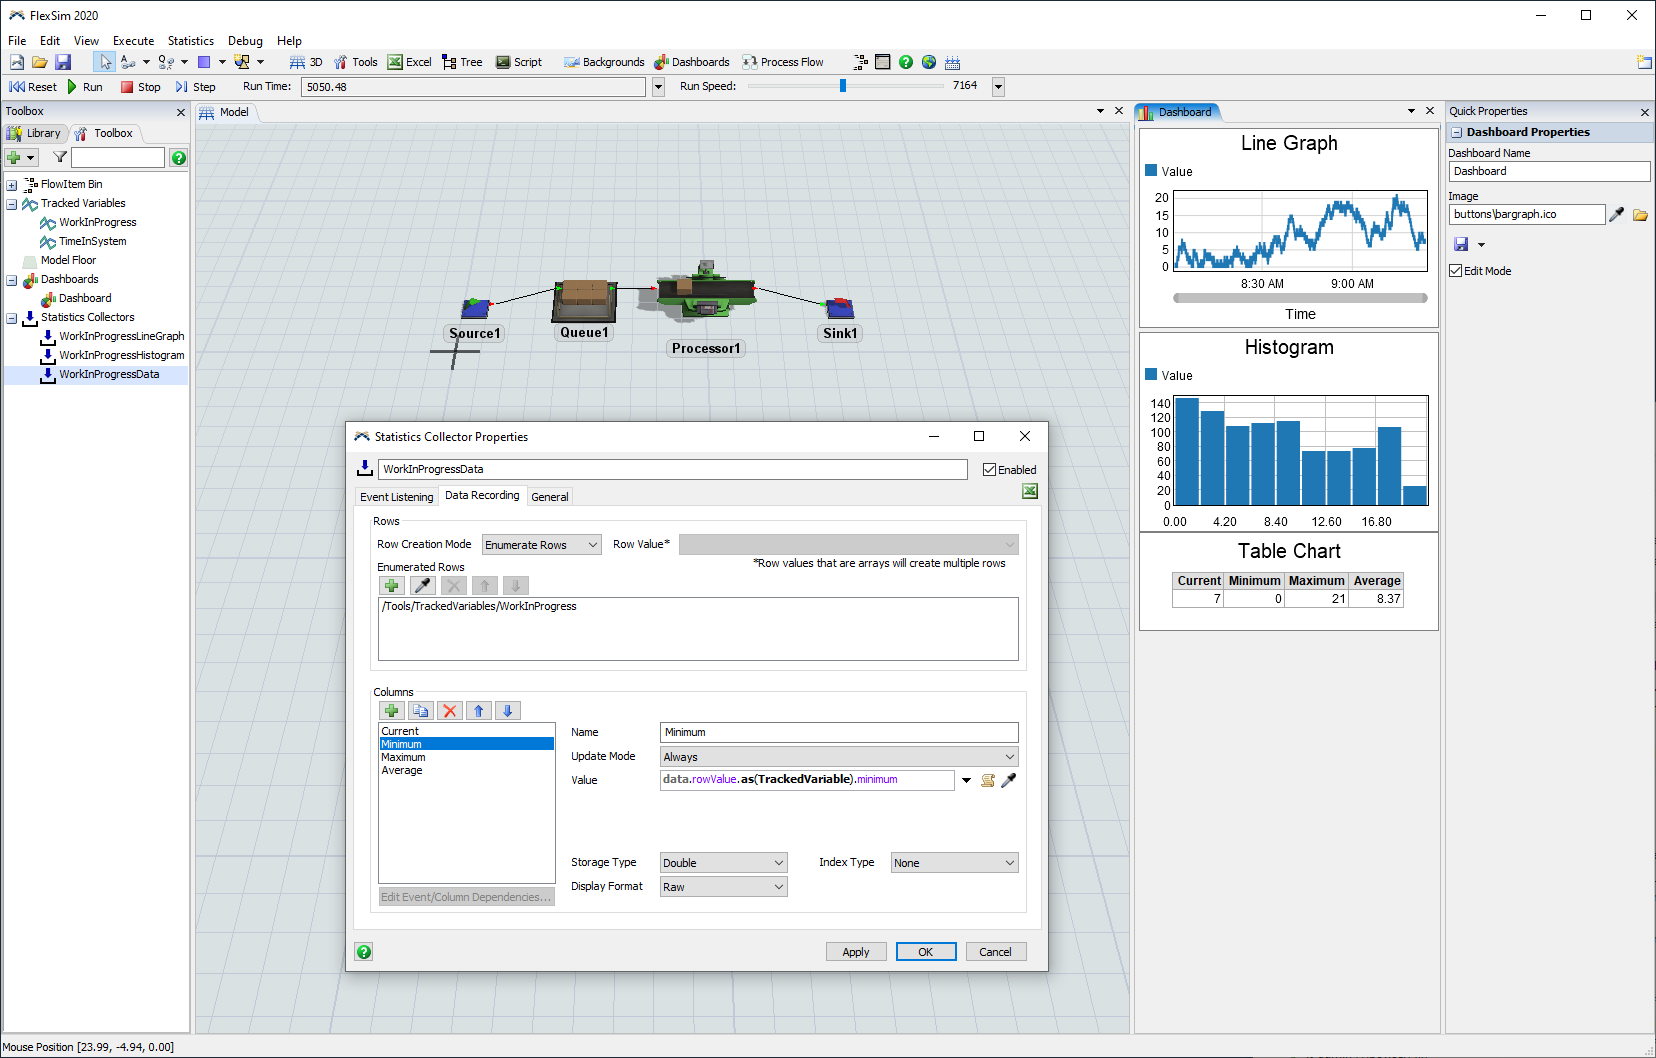
To configure this statistics collector, I did the following:
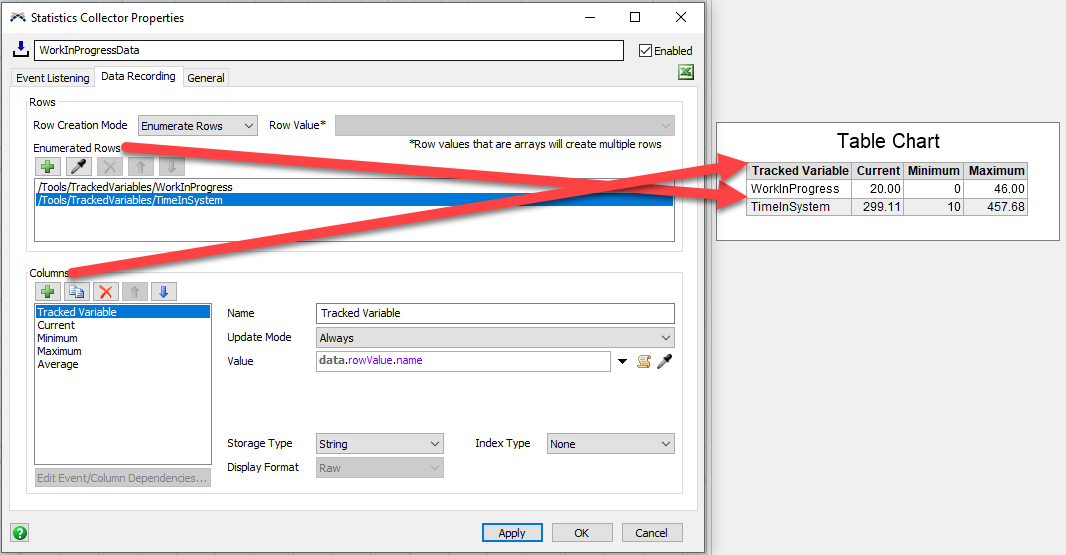
Using this method, you can actually create whatever table of data you want, including a matrix of this information for multiple statistics collectors:
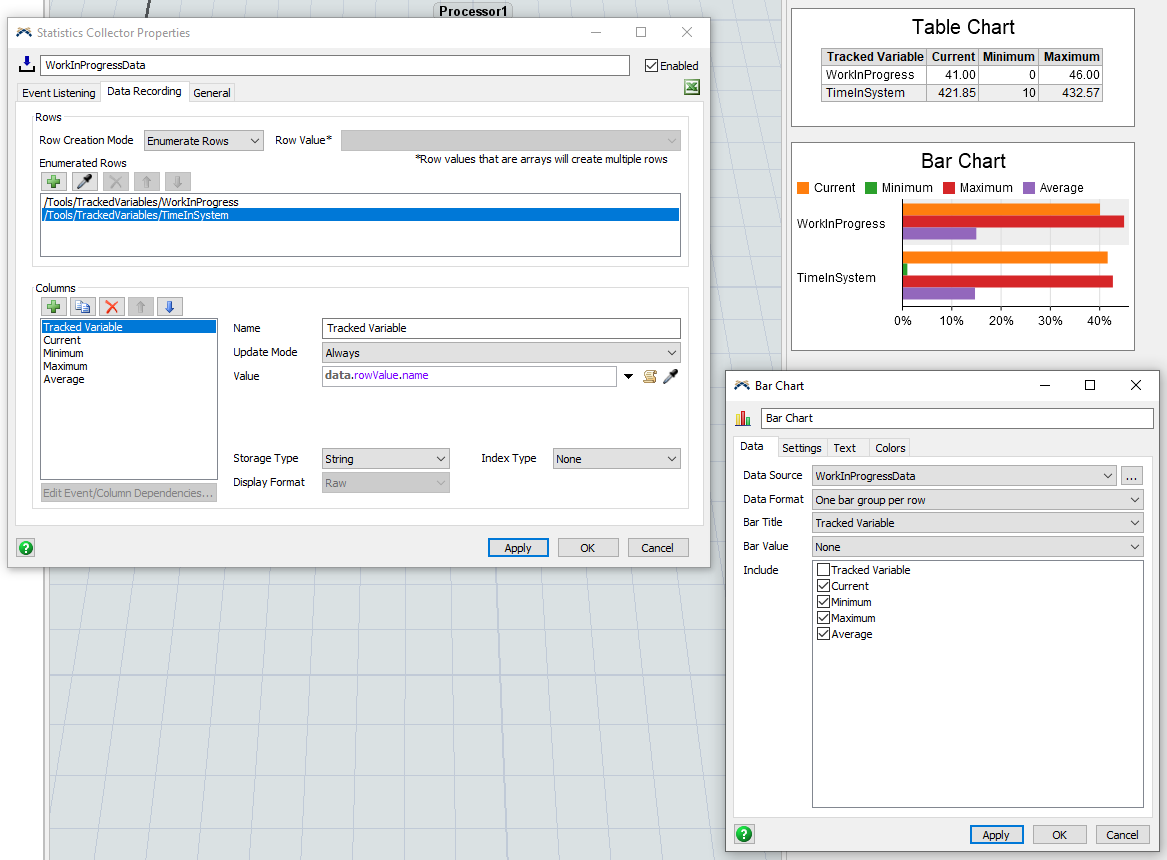
Then you can plot it on the dashboard using a variety of chart types:
15 People are following this question.
FlexSim can help you understand and improve any system or process. Transform your existing data into accurate predictions.
FlexSim is a fully 3D simulation software environment. FlexSim can be used to simulate any process in any industry.
FlexSim®, FlexSim Healthcare™, Problem Solved.®, the FlexSim logo, the FlexSim X-mark, and the FlexSim Healthcare logo with stylized Caduceus mark are trademarks of FlexSim Software Products, Inc. All rights reserved.
