question

Tee Hiett avatar image
0 Likes"
Tee Hiett asked tannerp commented

How do build Process Flow Charts in this tutorial model?

Tutorial 1_3.fsm

It the Attached Process Flow model, I would like to add 3 metrics to the dashboard:

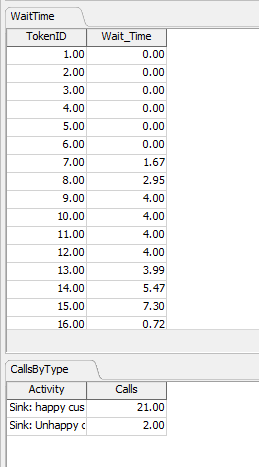
  • The number of Number of wait calls/ The number of total calls
  • the number of hang-up calls/the number of total calls
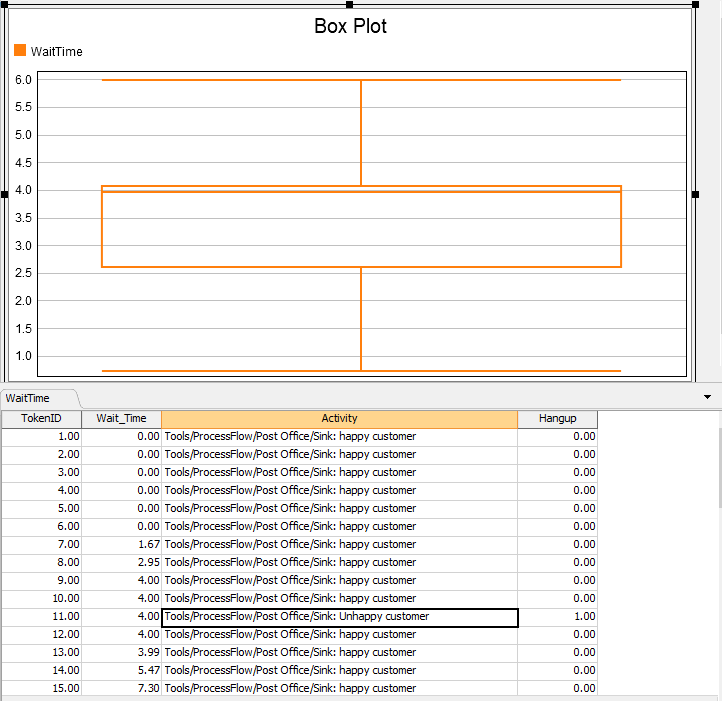
  • removing the 0-wait calls And the Hang-up calls, I would like a box plot of the waiting minutes for the Calls that actually had to wait.

Thanks for your help.

Tee

FlexSim 20.1.0
flexsim 20.1.0data collectorprocess flow chart
tutorial-1-3.fsm (150.6 KiB)
5 |100000

Up to 12 attachments (including images) can be used with a maximum of 23.8 MiB each and 47.7 MiB total.

1 Answer

tannerp avatar image
0 Likes"
tannerp answered tannerp commented

Hi @Tee Hiett,

Just to make sure I'm understanding the metrics correctly, I wanted to clarify a couple things:

1) "Wait calls" are any tokens that have to wait > 0 seconds at the Acquire Service activity AND end up receiving service.

2) "Hang-up calls" are any tokens that wait > 0 seconds at the Acquire Service activity AND do not receive service.

3) The total number of hang-up calls is equal to the throughput of the Unhappy Customers Sink.

If these are true, then we can easily get the total number of calls and the number of hang-up calls. We just need to get the number of wait calls. These would be any tokens that had a Staytime > 0 at the Acquire Service activity, correct?

I created a Calculated Table for some of these metrics, and I've got a Stats Collector that will collect the data you need on Wait Time at the Acquire Service activity. Let me know if I'm on the right track.

tee stats help_2.fsm


· 13
5 |100000

Up to 12 attachments (including images) can be used with a maximum of 23.8 MiB each and 47.7 MiB total.