question

Cody F avatar image
0 Likes"
Cody F asked tannerp edited

How to make a chart for average time chart for AGV at a location?

Model.fsm

How can I make a time chart that displays the average time an AGC is at one each of the below location that are circled in blue?
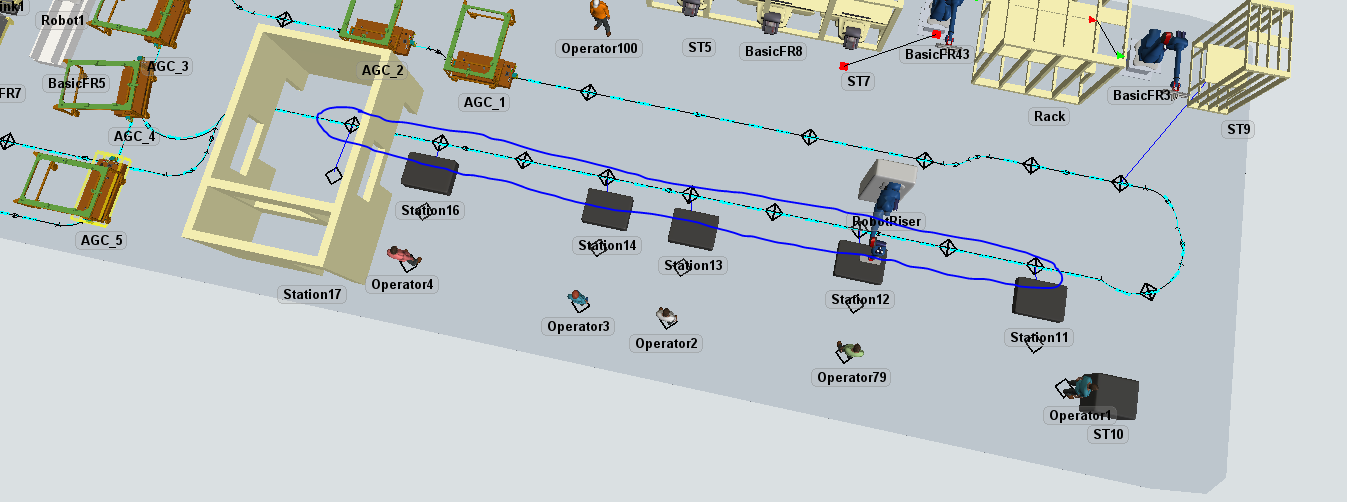
FlexSim 20.0.2
flexsim 20.0.2
model.fsm (10.0 MiB)
1587482237398.png (135.1 KiB)
5 |100000

Up to 12 attachments (including images) can be used with a maximum of 23.8 MiB each and 47.7 MiB total.

1 Answer

·
tannerp avatar image
0 Likes"
tannerp answered tannerp edited

Hi @Cody F,

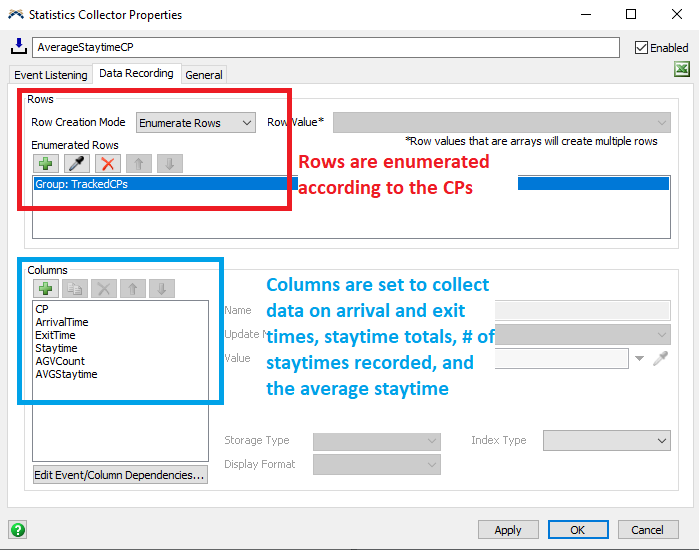
I apologize for the slow response to your question. Getting the staytime by control point is a feature that will be standard in 20.1. You can still achieve this in other versions, of course, it just requires a bit of setup. I've added a Statistics Collector to your model that listens to the group of control points you specified and collects data on arrival and exit times for each one. The Stats Collector then calculates the average staytime using the total staytime and the number of staytimes measured at each CP.

Here's the model. Let me know if you have any questions.

staytime agv stats_5.fsm


· 2
5 |100000

Up to 12 attachments (including images) can be used with a maximum of 23.8 MiB each and 47.7 MiB total.

Cody F avatar image Cody F commented ·

Thanks for the help. I also was able to get times by making a zone that created a token upon entry and then waited for deallocated to get my time in zone or time at each point. Then I created a chart for each stations zone to get the average, minimum and maximum.

1 Like 1 ·
tannerp avatar image tannerp Cody F commented ·

@Cody F That's great! If you're willing, it would be great for you to post your updated model here for the benefit of the community.

0 Likes 0 ·

Write an Answer

Hint: Notify or tag a user in this post by typing @username.

Up to 12 attachments (including images) can be used with a maximum of 23.8 MiB each and 47.7 MiB total.