question

Mike H5 avatar image
0 Likes"
Mike H5 asked Julie Weller commented

Dashboard statistics does not match performance charts

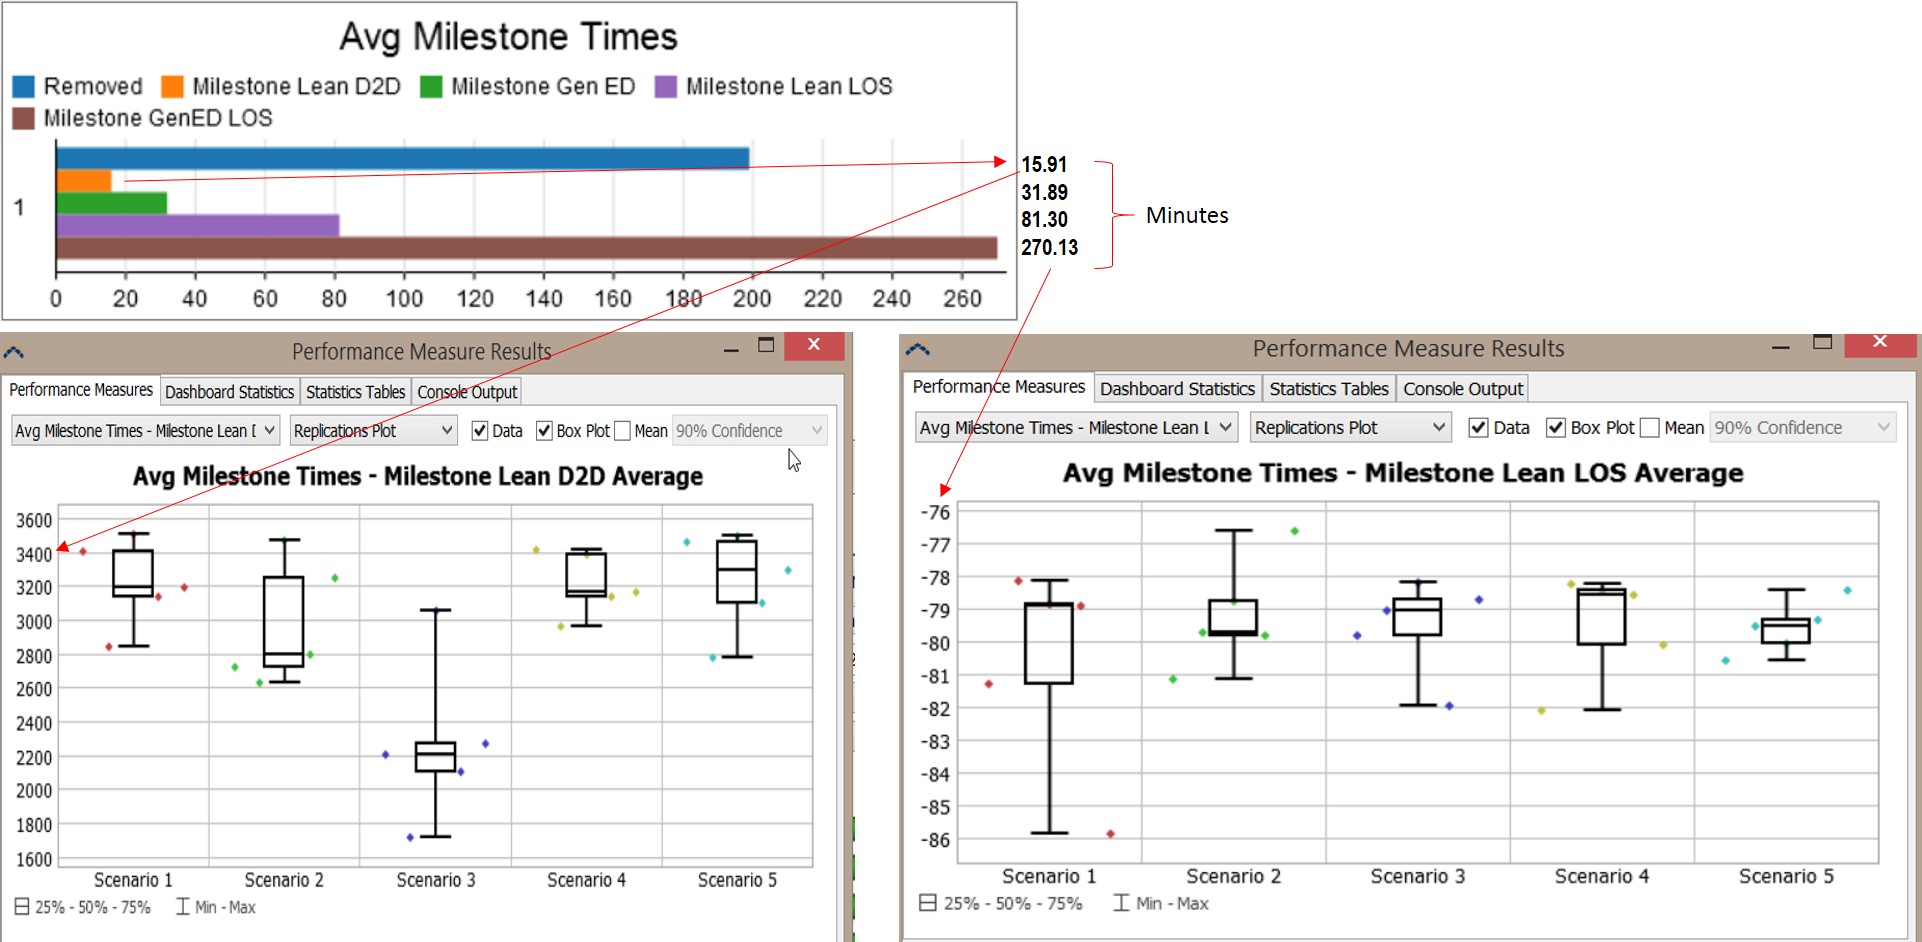
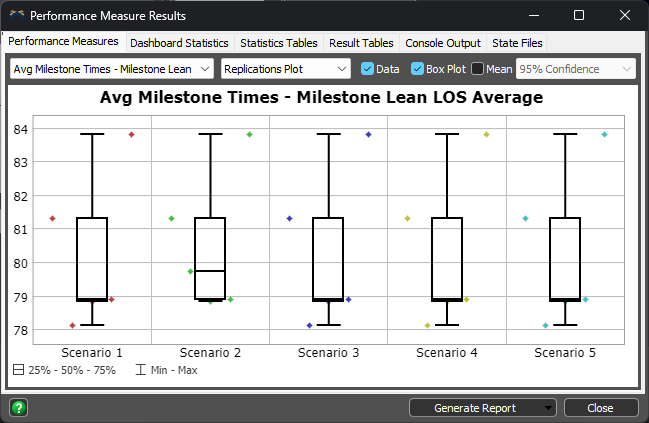
acmh-lean-model-rev-8-65-35-experimenter-7.fsmThe dashboard stats for the model have been validated and match expected outcomes as setup in the model and scenario 1. However the performance measure charts do not match the times on the dashboard. Are the numbers on the performance charts seconds? Where can I change them at. What are the negative numbers on the LOS graph? I have attached a photo and the model here. Thanks

FlexSim 20.1.1
flexsim 20.1.1performance measures
· 2
5 |100000

Up to 12 attachments (including images) can be used with a maximum of 23.8 MiB each and 47.7 MiB total.

Cliff King avatar image Cliff King commented ·

@Jordan Johnson might be able to give you some feedback on the Performance Measure Results. I don't have any experience with them. My chart of choice for experiment results is the Scenario Chart (see screenshot). It can summarize and display the results for any of your standard single run dashboard charts in a chart designed for experiments!

0 Likes 0 ·
1592019825307.png (65.2 KiB)
Julie Weller avatar image Julie Weller commented ·

Hi @Mike H5,

We haven't heard back from you. Were you able to solve your problem? Or please respond to the previous comment so that we can continue to help you.

If we don't hear back in the next 3 business days, we'll assume you were able to solve your problem and we'll close this case in our tracker. You can always comment back at any time to reopen your question, or you can contact your local FlexSim distributor for phone or email help.

0 Likes 0 ·

1 Answer

·
Jordan Johnson avatar image
0 Likes"
Jordan Johnson answered Jason Lightfoot edited

Concerning the performance measures shown on the right in your example, the negative numbers are a bug, where the time stamps are subtracted in the wrong order. The magnitude should be correct, but the sign is wrong. I'll put that on the dev list.

As for the performance measure values shown on the left, the performance measure values are not derived from the chart. They are showing the total of a group's average staytime, so it makes sense that the values are quite a bit higher than the averages on the bar chart.

· 4
5 |100000

Up to 12 attachments (including images) can be used with a maximum of 23.8 MiB each and 47.7 MiB total.

Sharan Nitin avatar image Sharan Nitin commented ·

@Jordan Johnson in which version we can expect the negative values bug to be resolved.? I am currently using FlexSim version 22 and it still exist.

0 Likes 0 ·
Jason Lightfoot avatar image Jason Lightfoot ♦ Sharan Nitin commented ·

It's fixed in version 22.0 - have you re-run the experiment?

Here's the PFM in version 22.0:

1685961191133.png

0 Likes 0 ·
1685961191133.png (26.5 KiB)
Sharan Nitin avatar image Sharan Nitin Jason Lightfoot ♦ commented ·

in dashboard i don't see the same. it doesn't capture the negative values.

0 Likes 0 ·
Show more comments

Write an Answer

Hint: Notify or tag a user in this post by typing @username.

Up to 12 attachments (including images) can be used with a maximum of 23.8 MiB each and 47.7 MiB total.