question

christoph gruber avatar image
0 Likes"
christoph gruber asked Jordan Johnson commented

How can I apply StatisticsCollector to the conveyor system

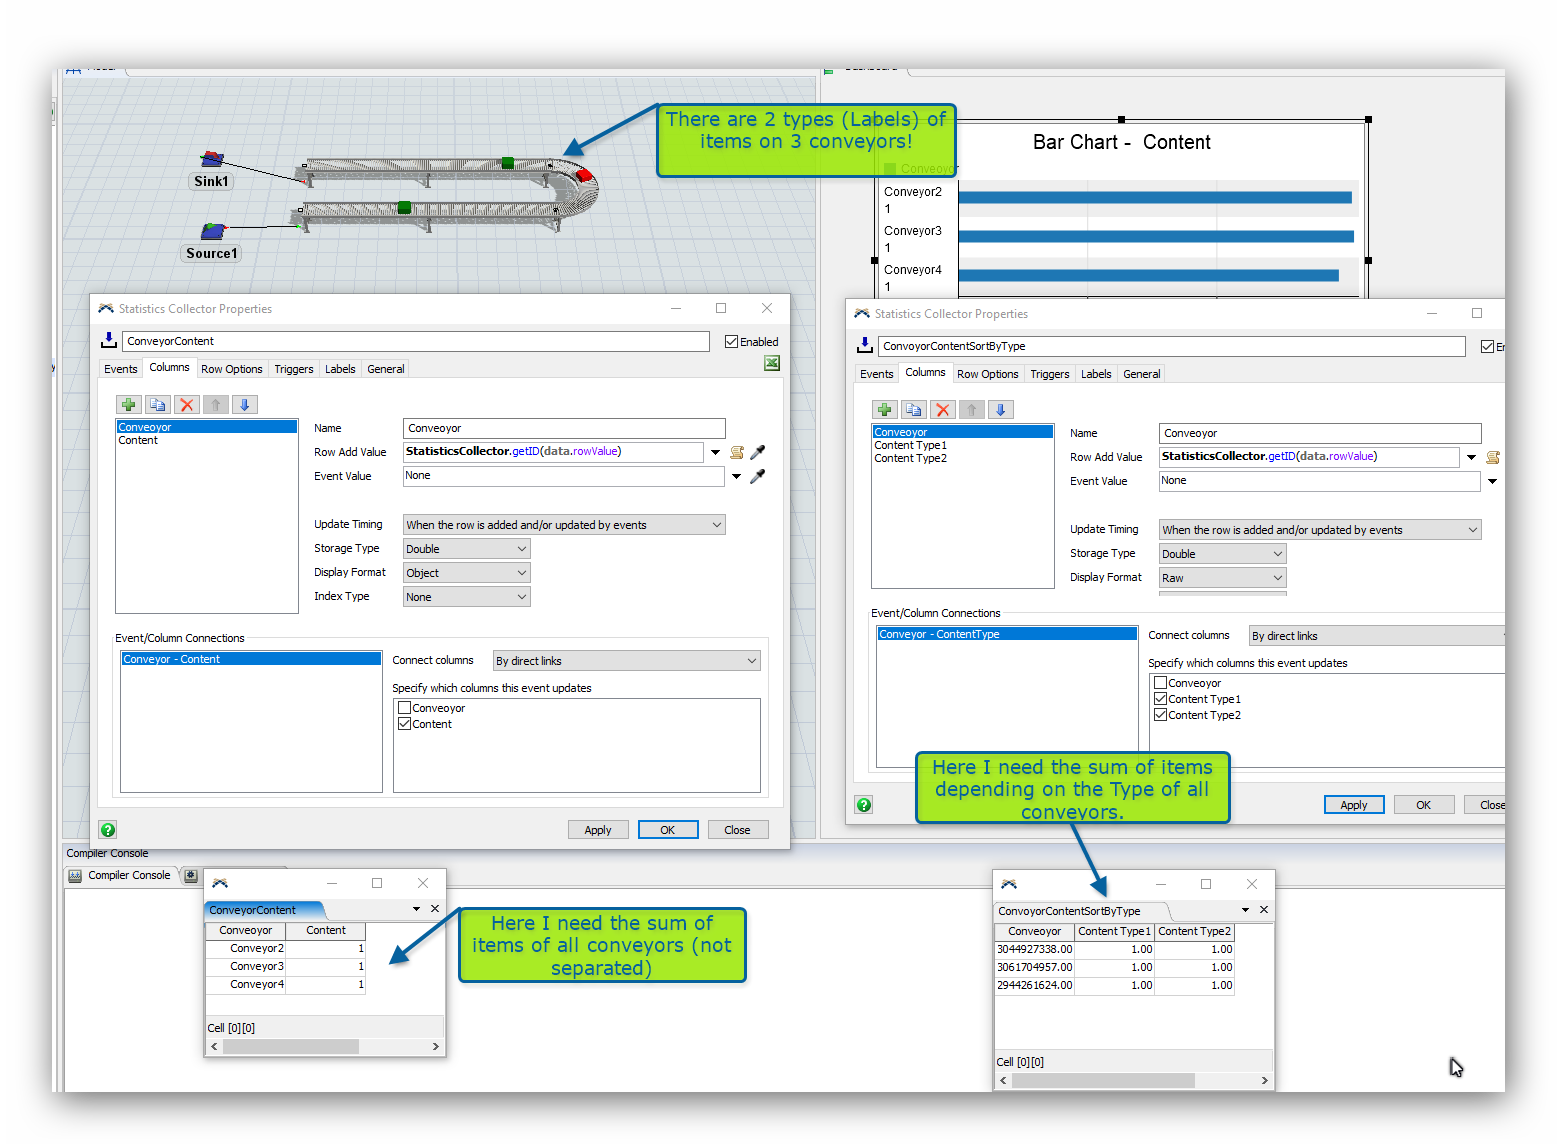
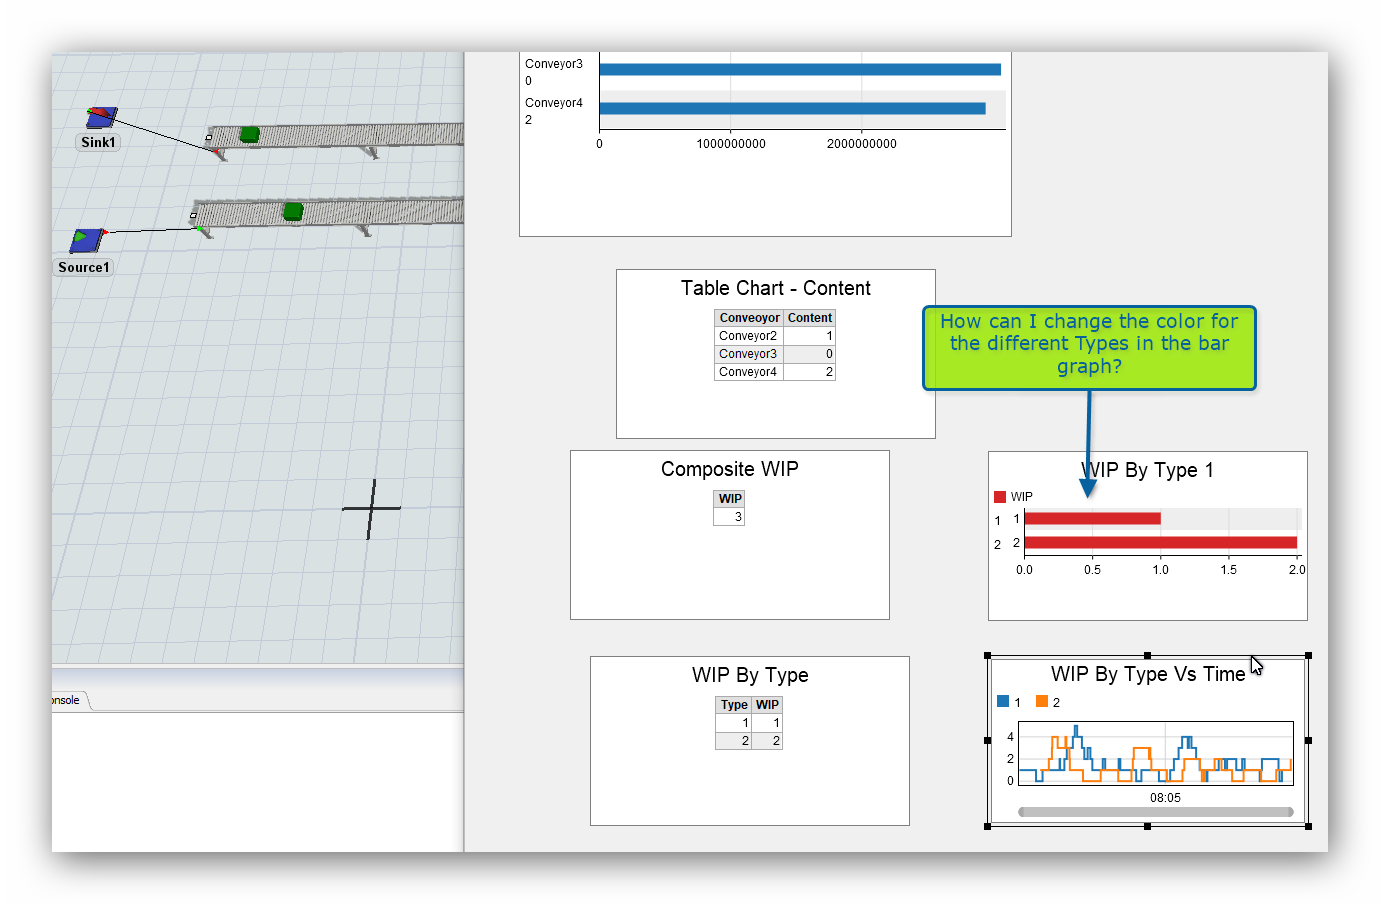
I`m confused with the StatisticsCollector and a conveyor system.

First I will show in a graph, how much items are currently in the conveyor system and second I will show in a graph too how much items from the different itemtyps are currently in the conveyor system. I can´t find the right options. Somebody can help me please or give me a hind? (see the model attached)

Thanks a lot in advance

StatisticsCollectorTestModel.fsm

FlexSim 20.1.3
flexsim 20.1.3conveyorsstatistics collector
5 |100000

Up to 12 attachments (including images) can be used with a maximum of 23.8 MiB each and 47.7 MiB total.

1 Answer

Jordan Johnson avatar image
0 Likes"
Jordan Johnson answered Jordan Johnson commented

There are two templates that can help you do this. The first is in the Composite WIP section of the Dashboard Library. It calculates the work in progress, or the "content" between a set of entrance objects, and a set of exit objects.

The second is in the WIP by Type section. Like the Composite WIP charts, it calculates the work in progress between the entrance and exit objects, but it splits it up by type.

In both cases, you can choose one of the charts in from the appropriate section. Note that if you choose a bar chart, it can be helpful to check the "show zero columns" box on the settings tab.

statisticscollectortestmodelwithcharts.fsm


· 3
5 |100000

Up to 12 attachments (including images) can be used with a maximum of 23.8 MiB each and 47.7 MiB total.