question

Amit Kulkarni avatar image
0 Likes"
Amit Kulkarni asked Amit Kulkarni commented

Control Point Statistics - Travel Time using Tracked Variable

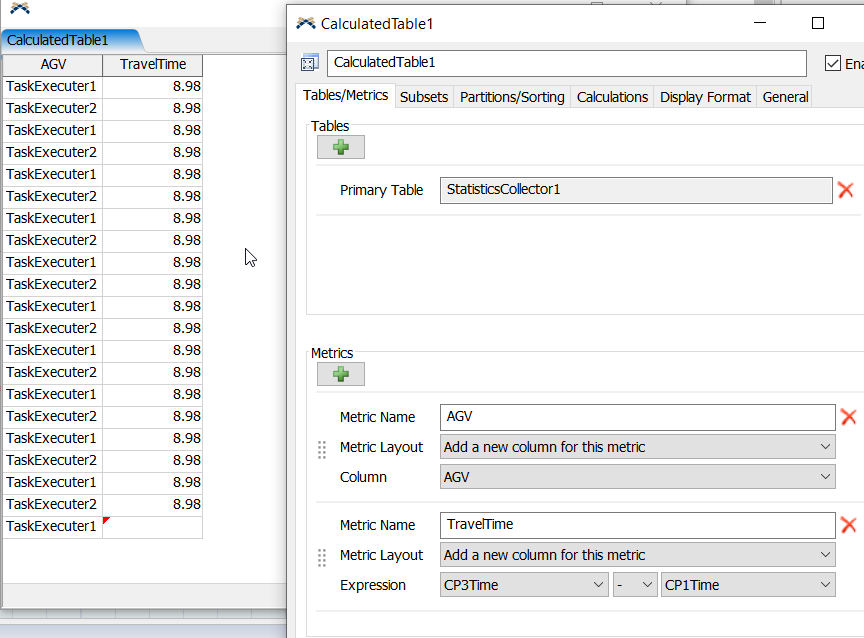
I know how t calculate the travel time between two control points before hand. I want to use a tracked variable to record and plot the time an AGV takes to travel between any two control points along its travel path.

e.g. travel time between CP1 and CP3, or CP6 and CP8.

How do I accomplish this using a tracked variable of the type time series? I have not added any statistics collector to the model since I am not sure if this can be done. Ho do I go about doing this?

AGV_Statistics_Collector_Travel_Time.fsm

FlexSim 21.0.2
statistics collectorflexsim 21.0.2control pointstracked variabletravel time
5 |100000

Up to 12 attachments (including images) can be used with a maximum of 23.8 MiB each and 47.7 MiB total.

1 Answer

tannerp avatar image
0 Likes"
tannerp answered Amit Kulkarni commented

@Amit Kulkarni,

I think the best setup to capture this would be if the AGV was actually given a travel task to TRAVEL TO CP1 and then TRAVEL TO CP3. Unfortunately, the AGV currently travels THROUGH CP1 and THROUGH CP3, meaning you can't listen to the On Arrival triggers for the control points.

That said, you can listen for the AGVs to Acquire the control points AFTER CP1 and AFTER CP3 because they will only acquire these control points when they arrive at CP1 and CP3.

Hopefully this is making sense so far.

To capture the times at which the AGVs pass over CP1 and CP3, you can set up a statistics collector to listen to the On Allocation triggers for the control points described above. You can set up the stats collector to save the AGV, the time for CP1, and the time for CP3 as columns.

Note that the row value is always data.agv and the CP1Time and CP3Time columns are updated by events.

Once we have this raw data, you can now calculate the time that it takes for the AGVs to travel between CP1 and CP3 using a Calculated Table. I'm not sure whether you want average times or if you want to calculate each individual time. I went ahead and calculated individual times, but it's easy to aggregate these.

I'm not sure how you'd like this plotted. Did you have an example or something in mind? Maybe a histogram for all the travel times?

Here's an updated version of the model with the Stats Collector and Calculated Table. Feel free to comment back with any questions.

agv-statistics-collector-travel-time_1.fsm


· 3
5 |100000

Up to 12 attachments (including images) can be used with a maximum of 23.8 MiB each and 47.7 MiB total.