question

Amit Kulkarni avatar image
0 Likes"
Amit Kulkarni asked Amit Kulkarni commented

Control Point Statistics using Tracked Variable

In attached model, I want to track the number of AGVs passing over a particular control point. The model was built using following posts as a reference

https://answers.flexsim.com/questions/30755/collecting-statistics-on-agvs-and-agv-networks.html and

https://answers.flexsim.com/questions/80701/graph-multiple-data-of-a-tracked-variable-in-one-c.html

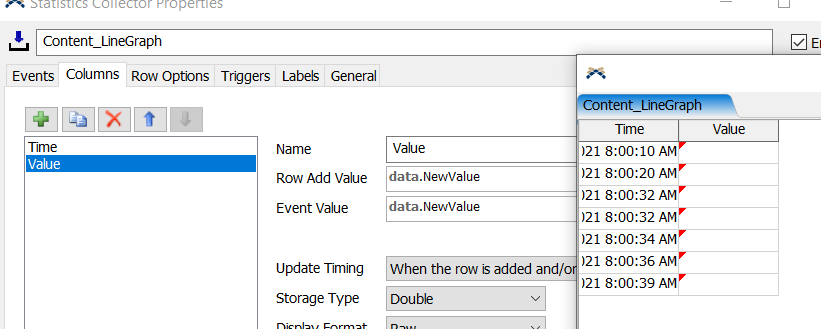
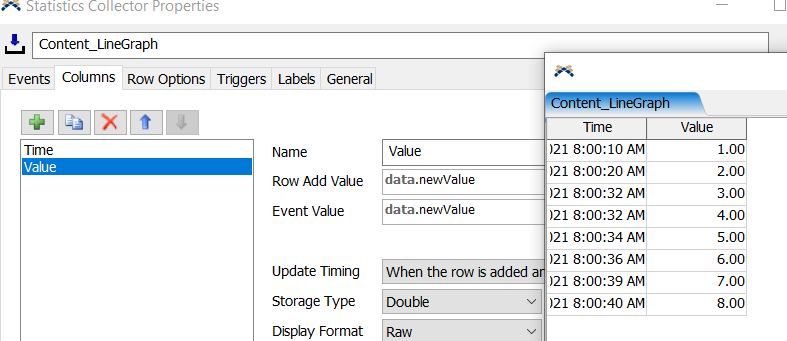
I created a tracked variable "Content" whose value is incremented by a Wait for Event Activity on entry of an AGV at CP8. A statistics collector is built that will give current, minimum, maximum and average value of this variable

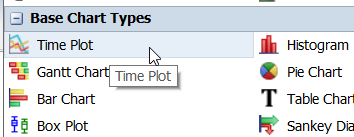
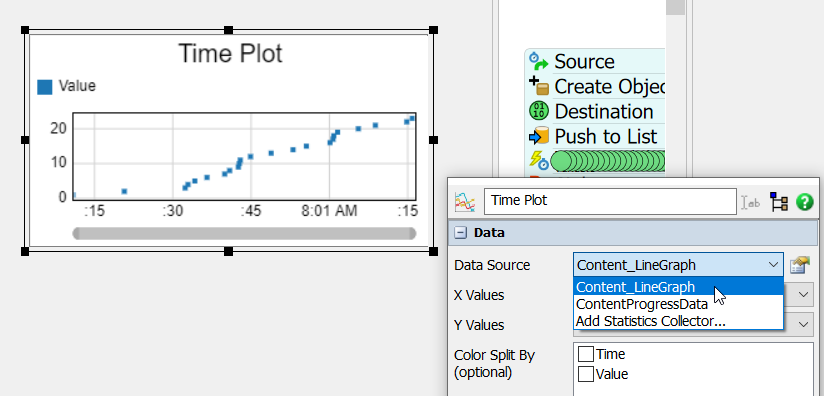
The difficulty lies in determining the type of chart that will plot this variable. What is it that I got wrong?

Control Point Statistics using Tracked Variable.fsm


FlexSim 21.0.2
agvdashboardsstatistics collectorflexsim 21.0.2tracked variables
5 |100000

Up to 12 attachments (including images) can be used with a maximum of 23.8 MiB each and 47.7 MiB total.

1 Answer

·
tannerp avatar image
1 Like"
tannerp answered Amit Kulkarni commented

Hi @Amit Kulkarni,

Thanks for doing the leg work and attaching a model for this question. I looked at the model you attached, and I think one of the things that was maybe throwing off your graph was that the Row Add Value & Event Value fields were both "data.NewValue" and they should be "data.newValue". This will solve the errors you're getting in the statistics collector (see pictures below).

Before:

After:

Once this is set up, you can use a basic Time Plot graph and set the data source to the "Content_LineGraph" Statistics Collector. That should give you what you need to watch the value of the Content variable change with time. Note that I didn't see the Content variable decrease, which is what I expected it would do based on your description. Hopefully this is working correctly.

Let me know if you have any questions about this.

Updated Model: control-point-statistics-using-tracked-variable_1.fsm


· 3
5 |100000

Up to 12 attachments (including images) can be used with a maximum of 23.8 MiB each and 47.7 MiB total.

Amit Kulkarni avatar image Amit Kulkarni commented ·

@tanner.p thanks for the clarification!

1 Like 1 ·
Amit Kulkarni avatar image Amit Kulkarni Amit Kulkarni commented ·

A simple follow up question, is there a way to use a table plot to see numeric values of the variable Content?

0 Likes 0 ·
Amit Kulkarni avatar image Amit Kulkarni Amit Kulkarni commented ·

I found it! I had that option minimized in the toolbar.

1 Like 1 ·

Write an Answer

Hint: Notify or tag a user in this post by typing @username.

Up to 12 attachments (including images) can be used with a maximum of 23.8 MiB each and 47.7 MiB total.