question

Saud A2 avatar image
0 Likes"
Saud A2 asked Jason Lightfoot commented

Using the Experimenter in the Statistics option

SDPII.fsm

I would like to run my model similar to a program like ARENA, which is using multiple replications and bring out specific results, such as average/min/max of a certain object in my model, I'm still new to this program, but I noticed that I need to add every single aspect before running the replications, This is my current model:

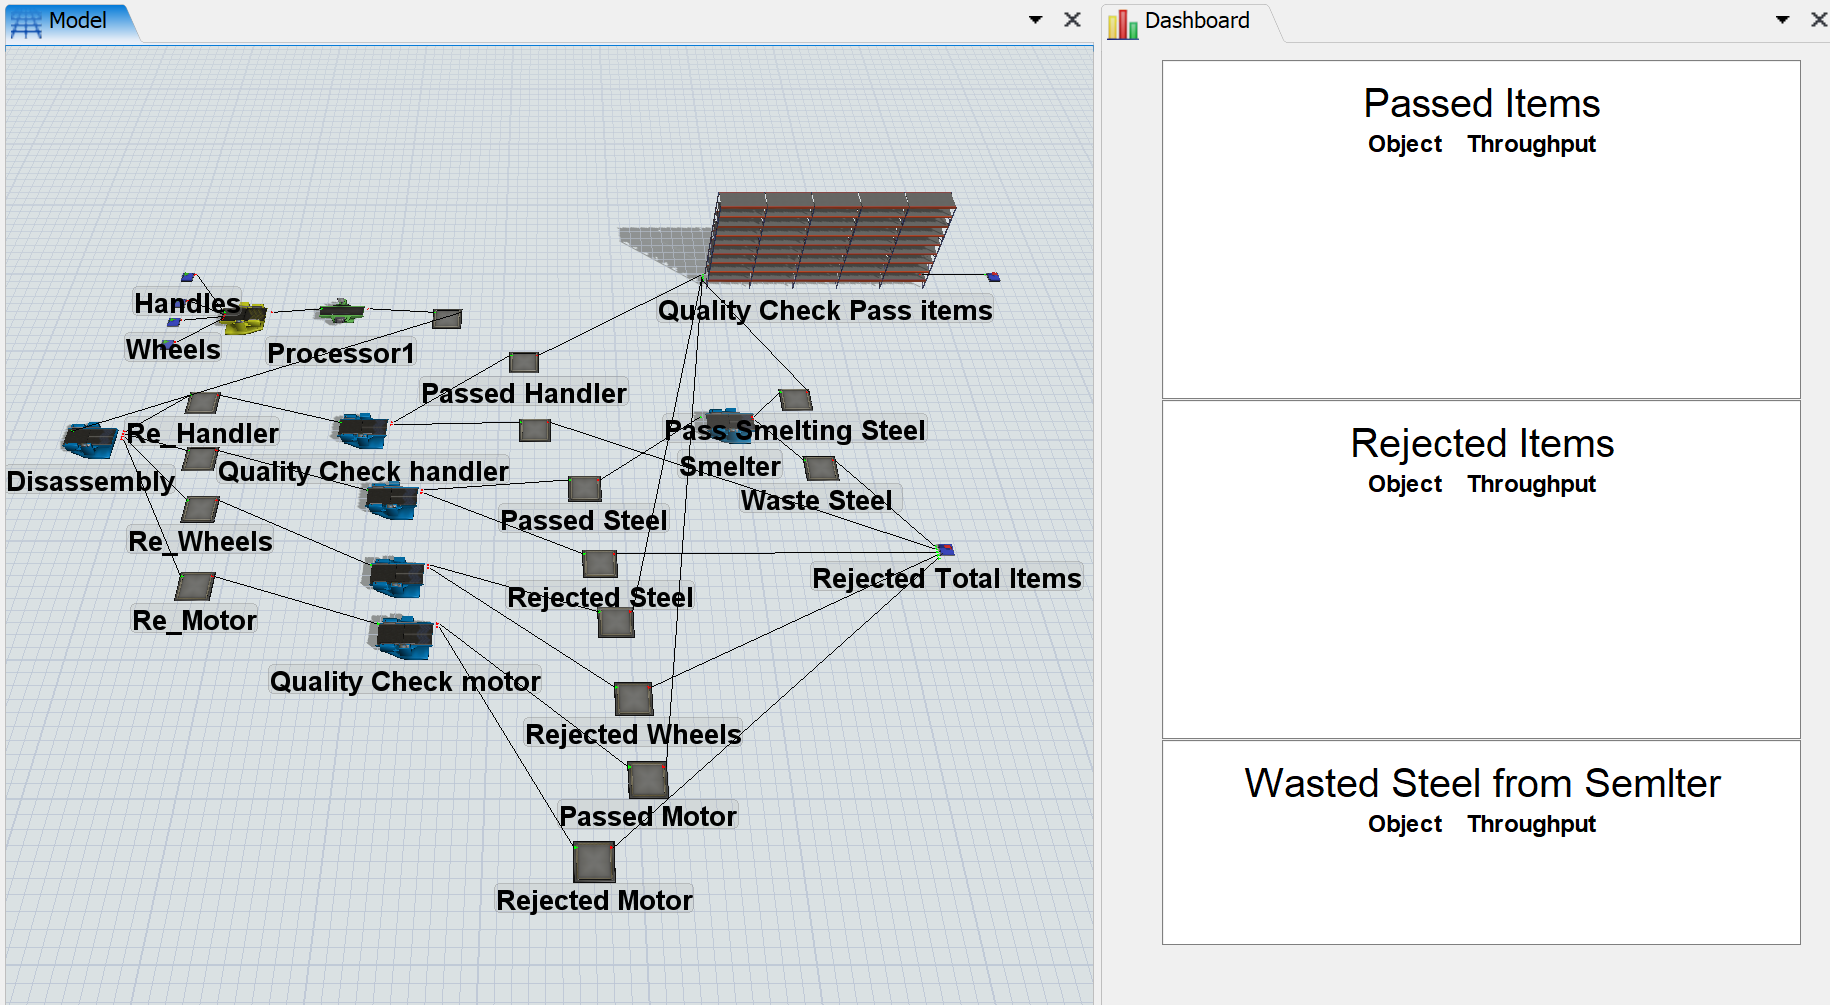
Its about a closed loop supply chain simulation, i added some dashboards for the continues run model:

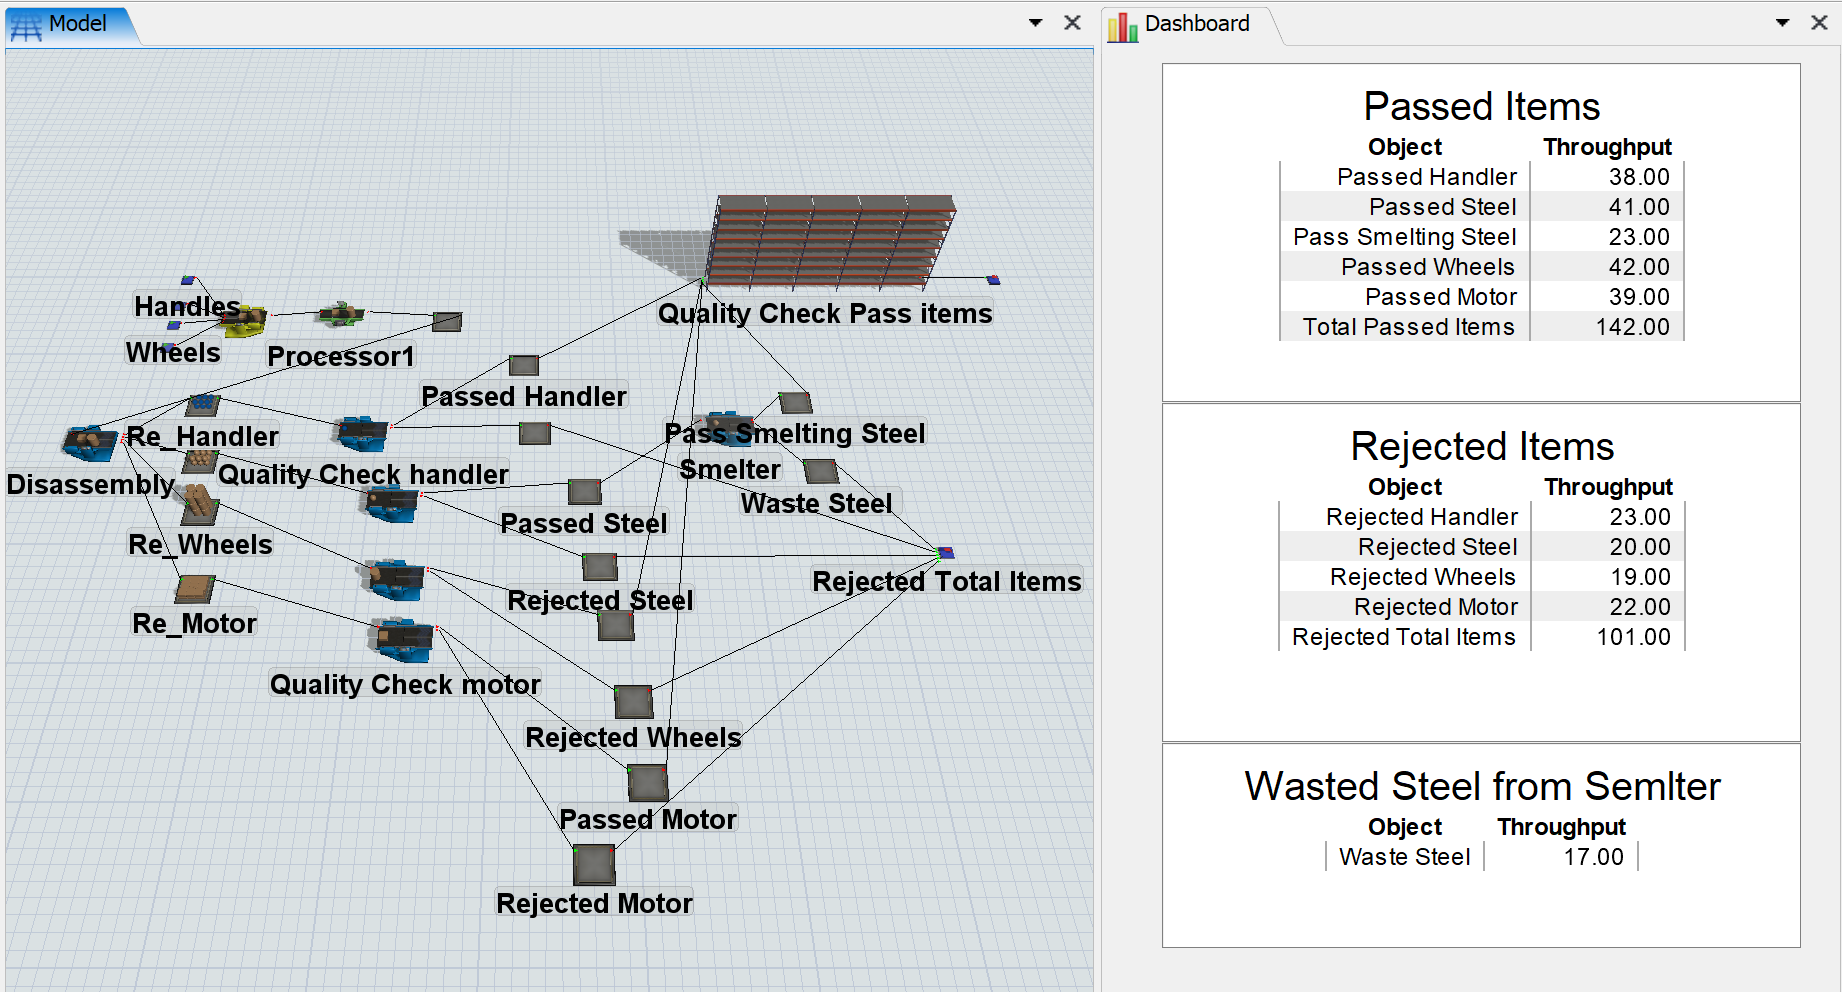
These are the current things i managed to do wich counting each specific item came back for dissasembly, which passed or got rejected, What i would like to do with using these counters is adding it in the expereminter:

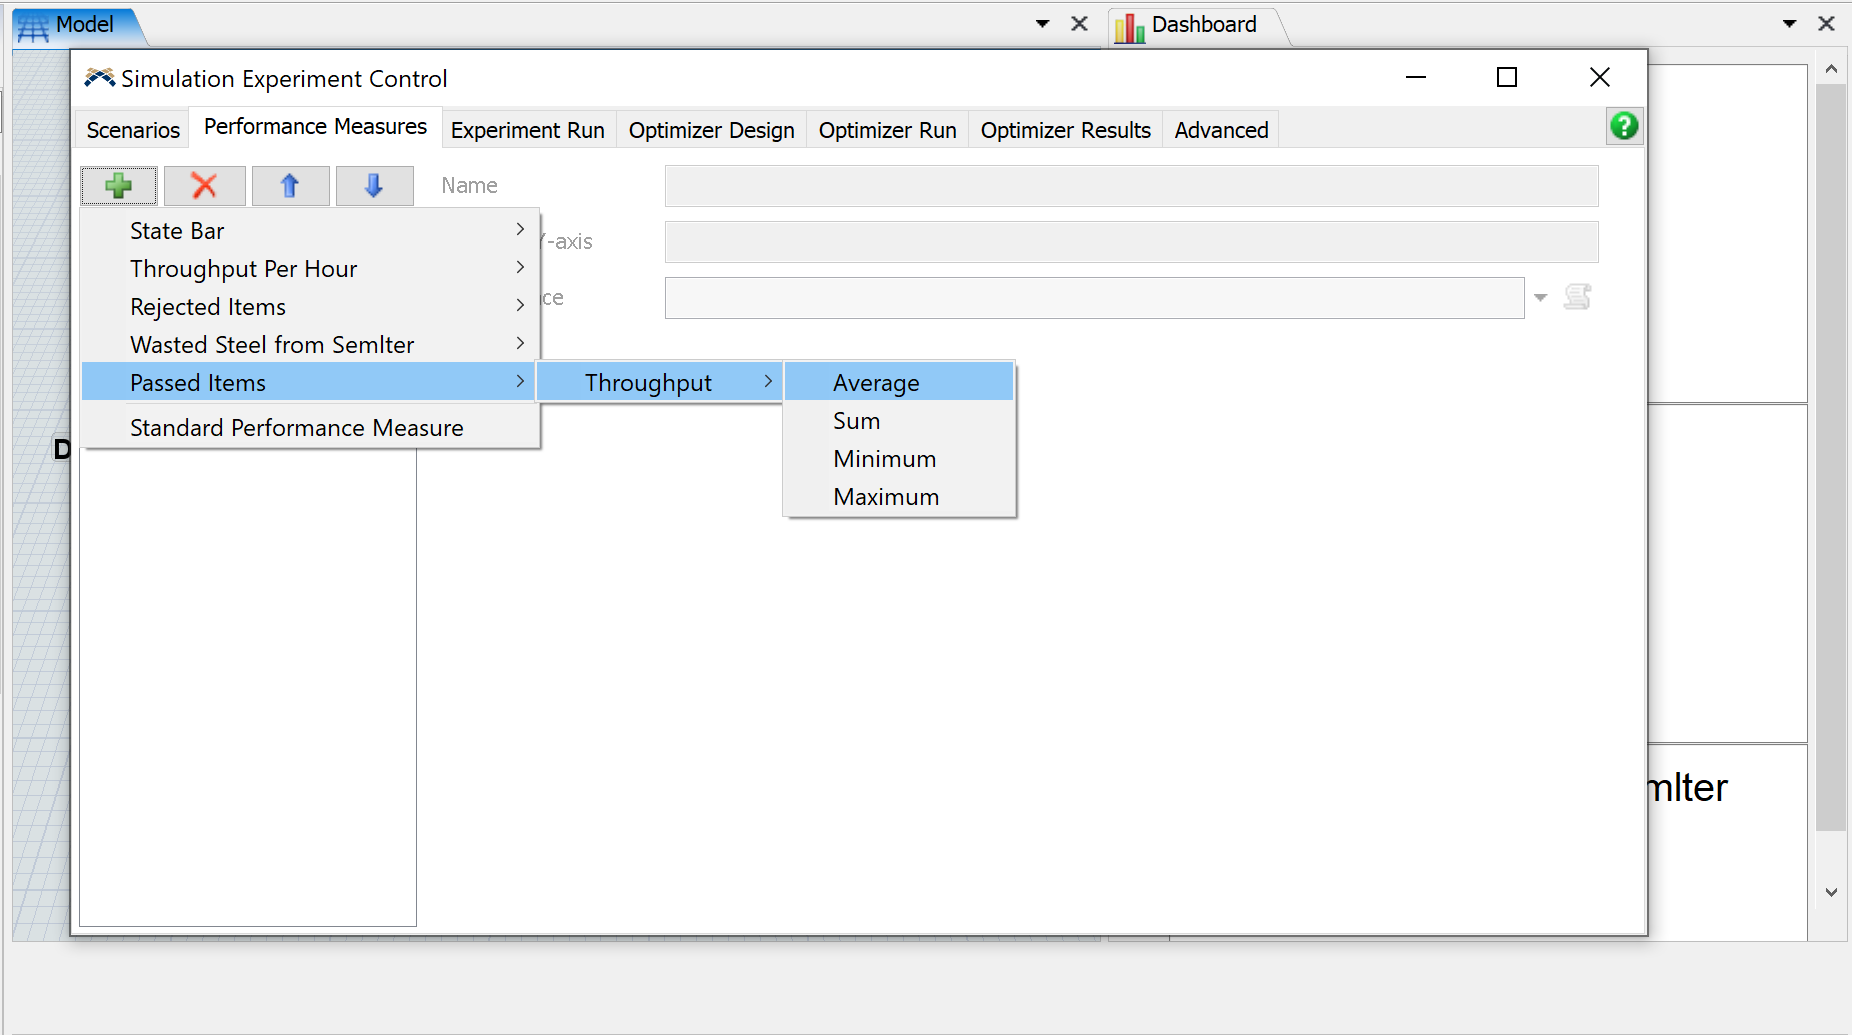
Thats the only way i knew on how to add the dashboards that i created, the problem is, the experminter generate the results in each dashboard is a whole, Avg/sum/min/max, it does not bring out specific data in the dashboard with these prefix, so i made a simple simulation of 5 riplication each has a duration of one hour:

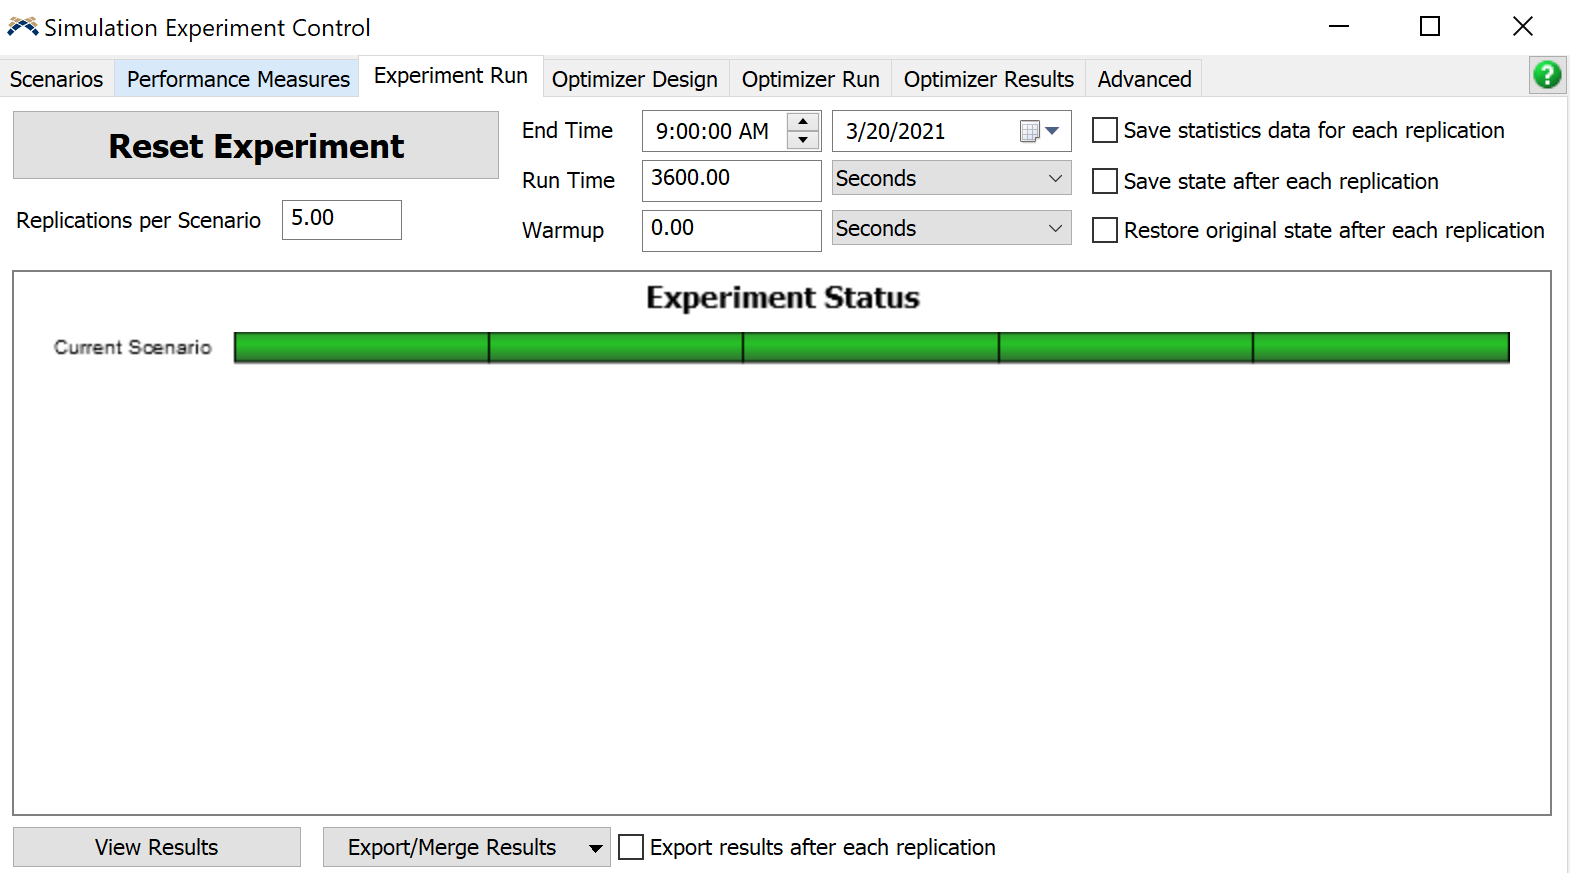
And this is the only result i could find:

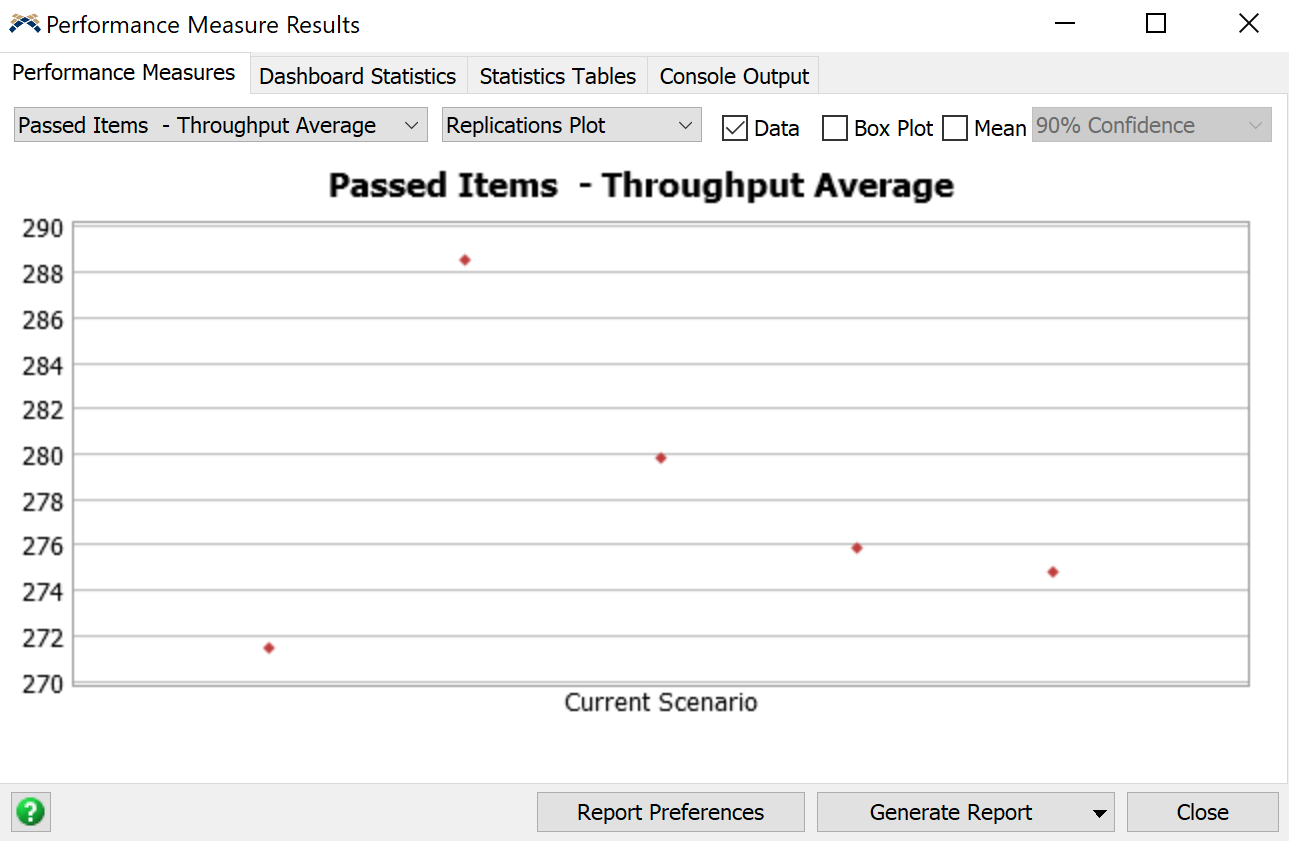
i tried to tweak here or there, couldnt manage to find anything more, anyone can help me to able to generate more results, and able to get more specific data such as avg time in process, and avg reject or pass in each individual object?


FlexSim 19.0.0
flexsim 19.0.0experimenter statisticsoutput datariplication
1617368292244.png (347.6 KiB)
1617368377224.png (381.5 KiB)
1617368530018.png (133.8 KiB)
1617368679471.png (84.0 KiB)
1617368715544.png (80.9 KiB)
sdpii.fsm (45.9 KiB)
5 |100000

Up to 12 attachments (including images) can be used with a maximum of 23.8 MiB each and 47.7 MiB total.

1 Answer

·
Jason Lightfoot avatar image
0 Likes"
Jason Lightfoot answered Jason Lightfoot commented

The dashboard statistics when added as a performance measure aggregate, they do not enumerate. You could write some script to add pfm statistics for groups of objects by looking at the performance measure tree structure, but as you're on such an old version and since the experimenter has changed in recent versions, the appetite for anyone to do this will be low.

It's only a small model you have so just add the statistics you want individually from the performance measure tab of the experimenter.

· 2
5 |100000

Up to 12 attachments (including images) can be used with a maximum of 23.8 MiB each and 47.7 MiB total.

Saud A2 avatar image Saud A2 commented ·

oh so like each object would be in its own dashboard? i guess that would work, similar to the counter method I'm using currently, I'm sorry that my version is old, it's just what the university is giving us, and I can't seem to update my version to the newest one without a new key of some sort.

0 Likes 0 ·
Jason Lightfoot avatar image Jason Lightfoot ♦ Saud A2 commented ·

You don't need a dashboard for any performance measure in the experimenter. Just add them using the sampler and select the statistic you want.

0 Likes 0 ·

Write an Answer

Hint: Notify or tag a user in this post by typing @username.

Up to 12 attachments (including images) can be used with a maximum of 23.8 MiB each and 47.7 MiB total.