question

Arvind J avatar image
0 Likes"
Arvind J asked Felix Möhlmann answered

The bar chart didn't show for processor


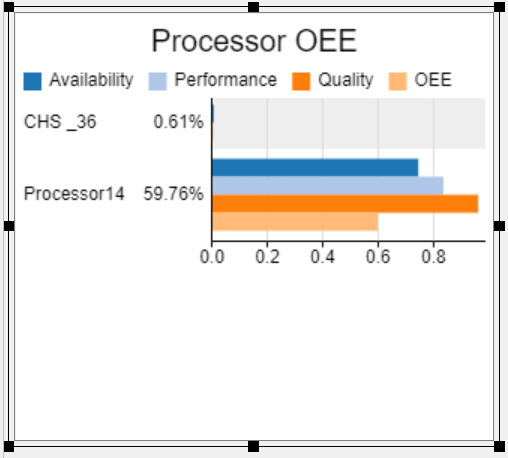
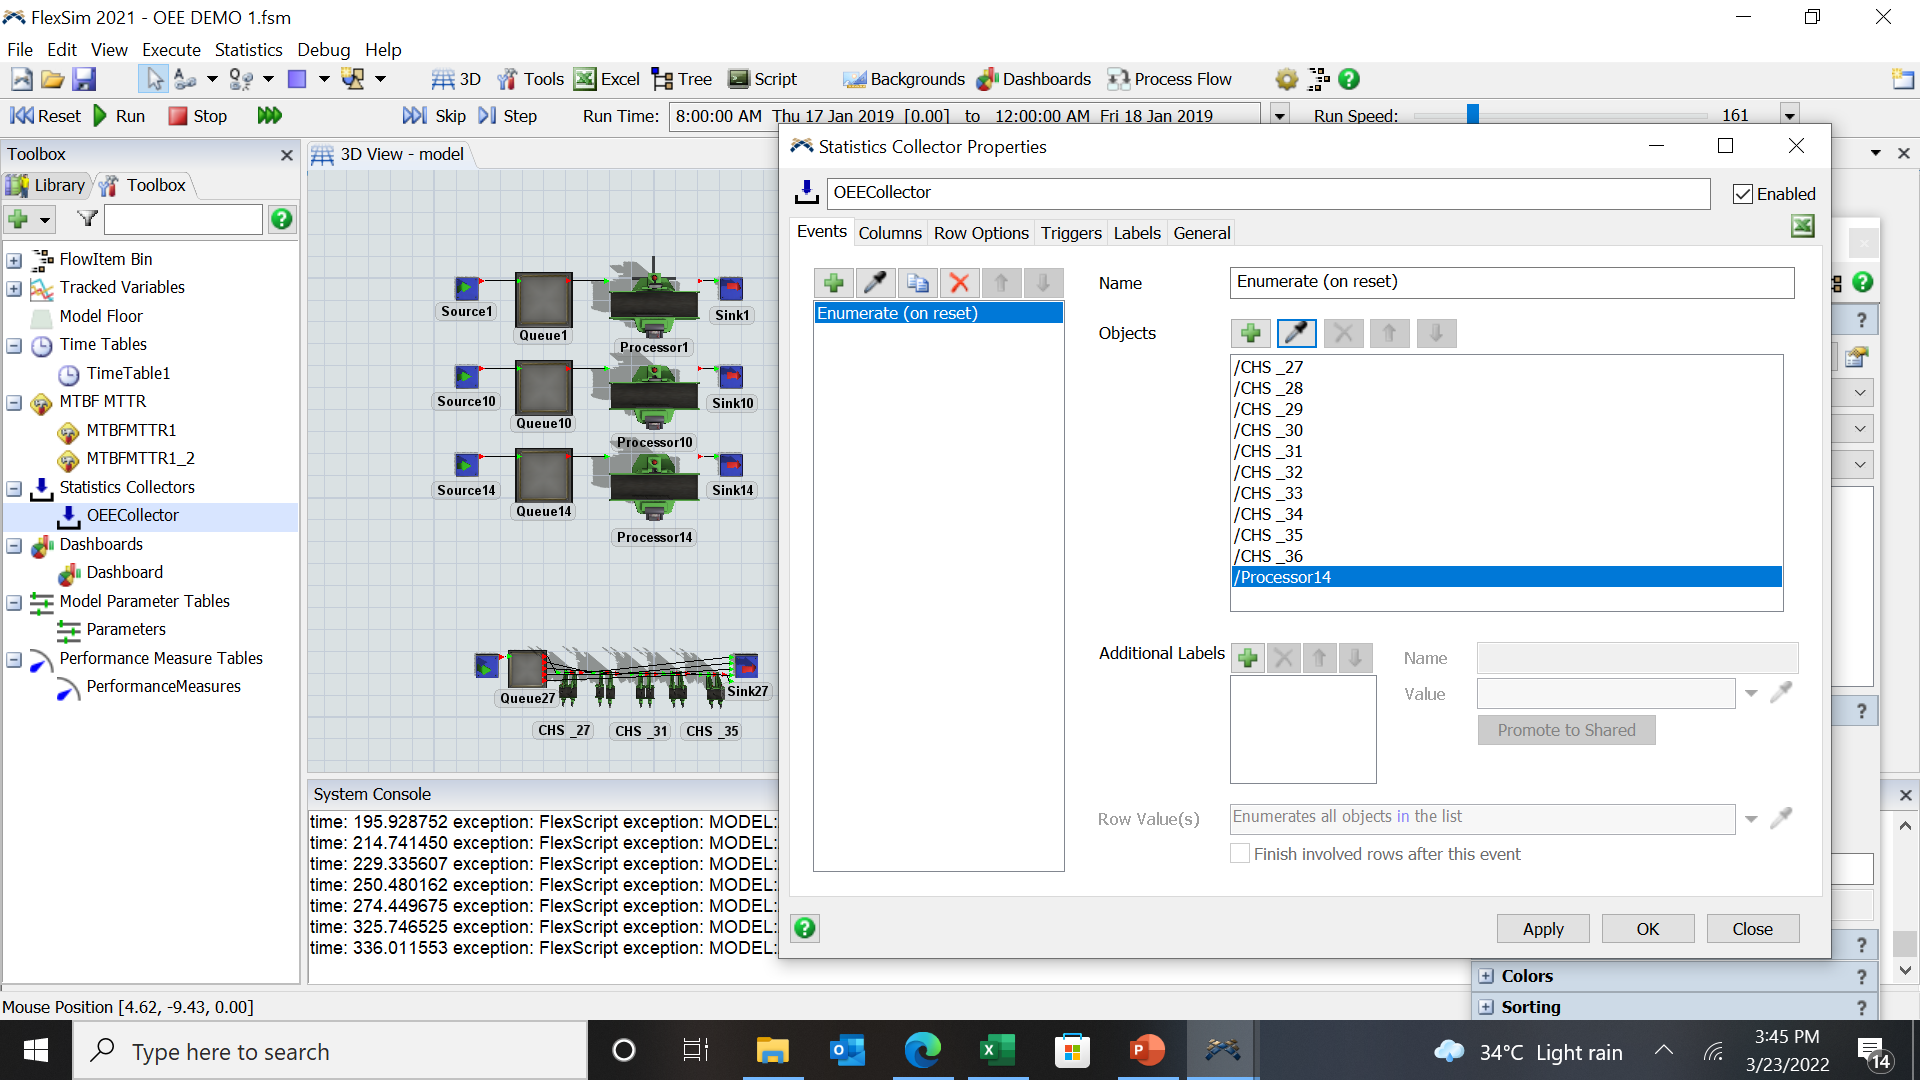
Hi All, I'm facing some issues to show bar chart in my dashboard. When the Processor14 is selected, it'll show the graph. If I selected the rest of processor as below, it didn't show the graph.

1648021656193.png


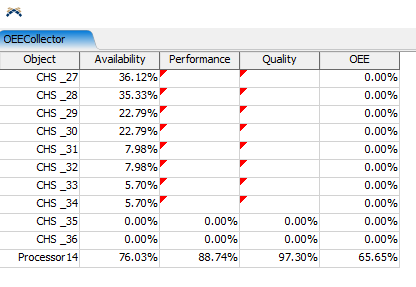
As you can see picture below, the bar chart only show for Processor14. For CHS_36, the bar chart didn't show at all. Kindly advice.

1648021700775.png


OEE DEMO 1.fsm

FlexSim 21.1.4
processordashboard databar chart
1648021656193.png (349.0 KiB)
1648021700775.png (30.7 KiB)
oee-demo-1.fsm (1.5 MiB)
5 |100000

Up to 12 attachments (including images) can be used with a maximum of 23.8 MiB each and 47.7 MiB total.

1 Answer

·
Felix Möhlmann avatar image
0 Likes"
Felix Möhlmann answered

The "CHS" processors are missing the "RejectedItems" and "IdealCycleTime" labels that are used to calculate the Performance and Quality columns in your Statistics Collector. As such no valid values are generated for those columns.

1648024589502.pngYou might also want to the check the "Show Zero Columns" option to show all processors in the chart from the start.
1648024553930.png


1648024553930.png (3.4 KiB)
1648024589502.png (13.4 KiB)
5 |100000

Up to 12 attachments (including images) can be used with a maximum of 23.8 MiB each and 47.7 MiB total.

Write an Answer

Hint: Notify or tag a user in this post by typing @username.

Up to 12 attachments (including images) can be used with a maximum of 23.8 MiB each and 47.7 MiB total.