question

Abhay Bajpai avatar image
0 Likes"
Abhay Bajpai asked Felix Möhlmann answered

Unable to plot Tracked Variable on a graph

Based on the example shown in the following link, I thought of trying it out myself.

https://answers.flexsim.com/questions/41253/output-per-hour-1.html


I am interested in plotting the number of ModelNames stored in the 'YARD' on a 8 hours shift.

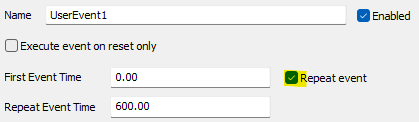
I tried to follow the recommendation based on the link above and added Tracked Variable and the the code in the User Event. But for some reason the graph is not able to populate. My guess is that the model does not understand what to count? Please let me know.

ChampionHomes_V8_9_autosave.fsm

FlexSim 23.2.0
statistic
5 |100000

Up to 12 attachments (including images) can be used with a maximum of 23.8 MiB each and 47.7 MiB total.

1 Answer

·
Felix Möhlmann avatar image
0 Likes"
Felix Möhlmann answered

Your user event is currently only executed once at the start of the model, so the Tracked Variable is not updated.

1697696320017.png

You should also take a look at your stacking logic. When I run your model I get a lot of errors because you are stacking items for which there are no entries in the "partLocMap" of the respective container item.


1697696320017.png (6.8 KiB)
5 |100000

Up to 12 attachments (including images) can be used with a maximum of 23.8 MiB each and 47.7 MiB total.

Write an Answer

Hint: Notify or tag a user in this post by typing @username.

Up to 12 attachments (including images) can be used with a maximum of 23.8 MiB each and 47.7 MiB total.