question

Borja Lorenzo avatar image
0 Likes"
Borja Lorenzo asked Borja Lorenzo commented

Start graph at 0.0

Hello,

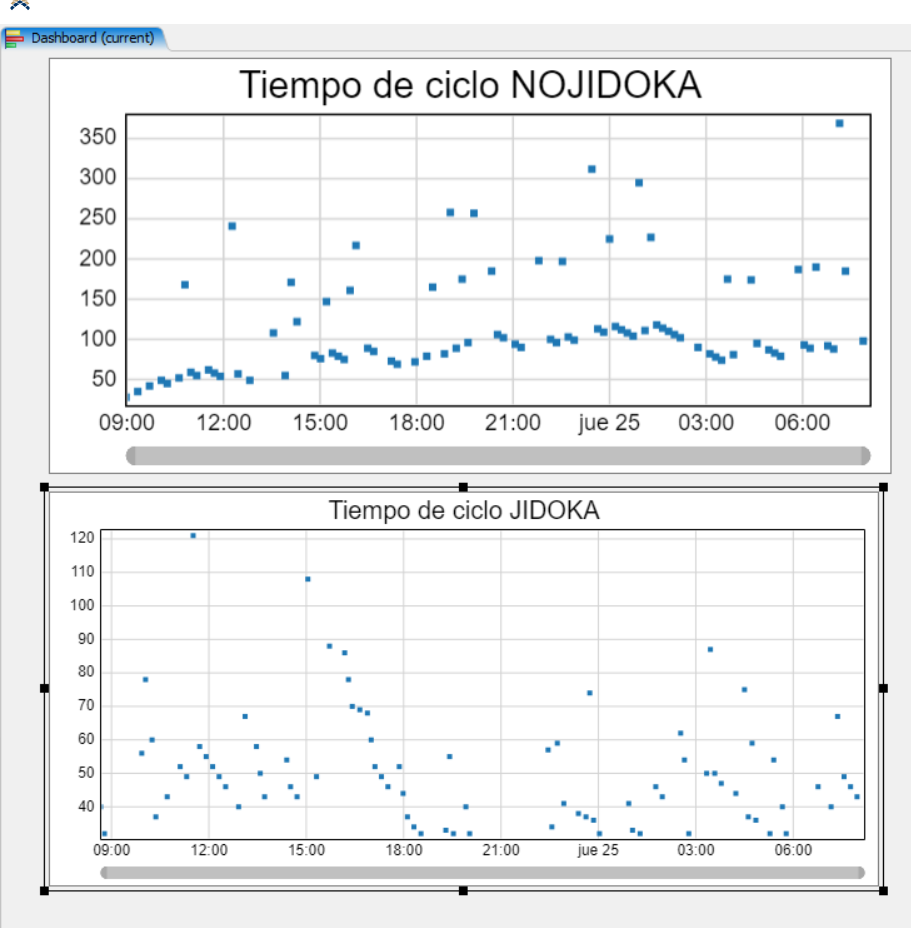
In the attached model, you can see two graphs that represent the cycle times of each item in each of the systems (JIDOKA, NO JIDOKA).

The graphs are related to a tracked variable in each system that records the entry into the sinks of each system. I created the graphs directly from the pin to generate statistics.
1722508228401.png

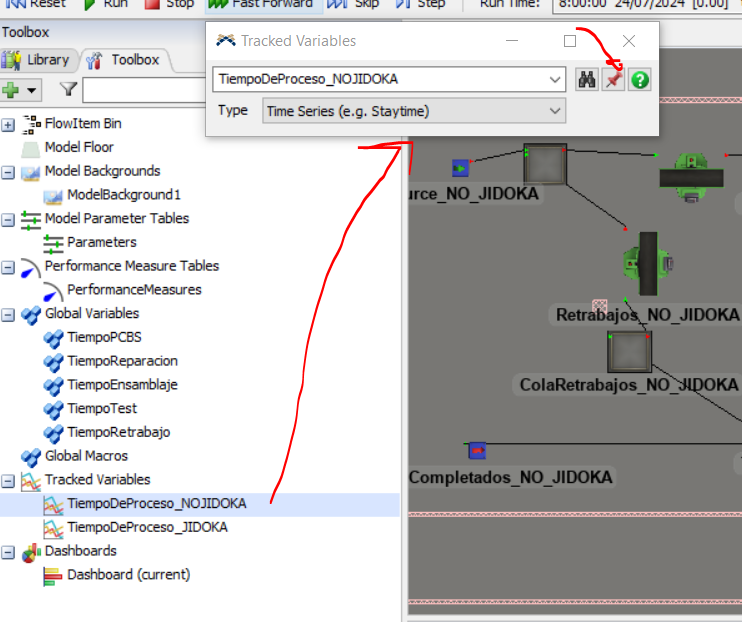
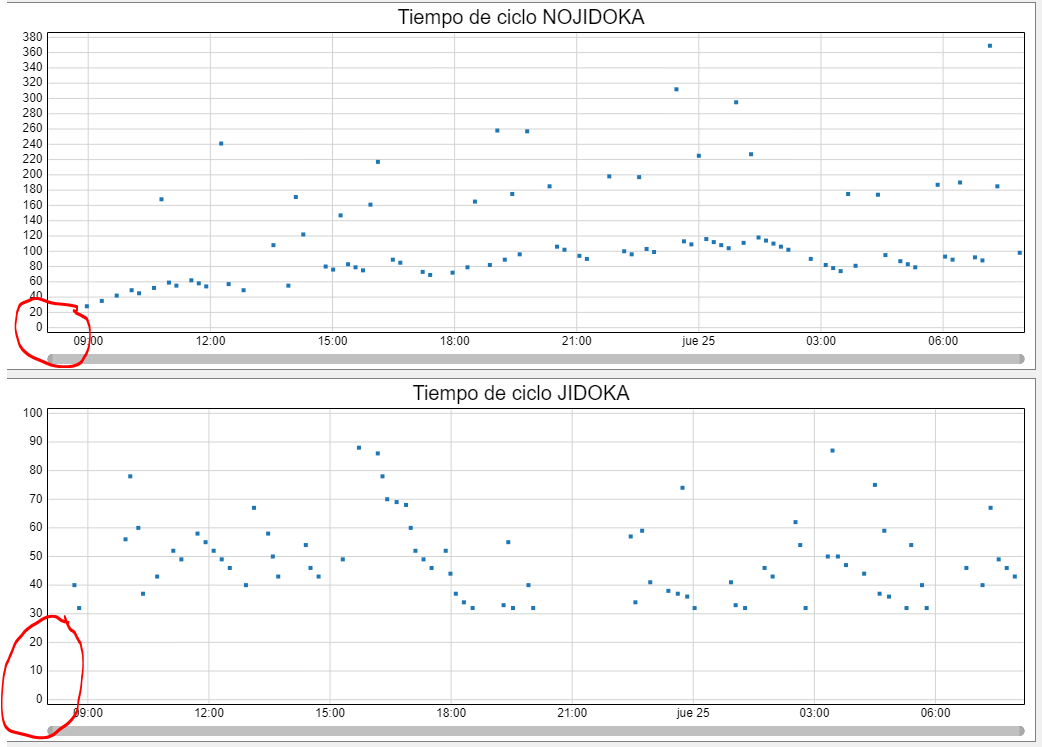
The problem I’ve identified is that the graphs start from the value 0.0, or at least it seems that the sink is recording an entry at the 0.0 instant. This is not accurate.


What is happening and how can I correct it?

20240801_CP11_libro_FlexSim_Jidoka_3.fsm

This question is related to a previous discussion: input vs time for sink to dasboard using statics collector - FlexSim Community

FlexSim 24.1.1
graphson resetaxis grah
5 |100000

Up to 12 attachments (including images) can be used with a maximum of 23.8 MiB each and 47.7 MiB total.

1 Answer

Felix Möhlmann avatar image
1 Like"
Felix Möhlmann answered Borja Lorenzo commented

Install the chart's components from the Advanced tab in its properties to be able to access the Statistics Collector.

capture1.png

Then delete both the OnReset and OnWarmup events.

capture2.png

20240801-cp11-libro-flexsim-jidoka-3_1.fsm


· 3
5 |100000

Up to 12 attachments (including images) can be used with a maximum of 23.8 MiB each and 47.7 MiB total.

Borja Lorenzo avatar image Borja Lorenzo commented ·

Here are the graphs before applying the solution:

1722512888259.png


It is evident that in both graphs, the representation now starts at the point where the first item is received at the sink. In other words, the X and Y axes have shifted to the first point.


How can I ensure that the axes do not shift to the point where the first item is received but still avoid marking the 0.0 as a point? I would like to see it as it appears here but without that point at 0.0.

1722512935929.png


0 Likes 0 ·
1722512888259.png (134.4 KiB)
1722512935929.png (134.4 KiB)
Felix Möhlmann avatar image Felix Möhlmann Borja Lorenzo commented ·

I am pretty sure you can't. The start point of the x-axis is defined by the first data point. You could add a data point with a negative value at time 0 and set a fixed range for the graph so the point doesn't appear in the chart but it would still be present in the data set and need to be filtered out if you calculate an average value for example.

20240801-cp11-libro-flexsim-jidoka-3_2.fsm

1 Like 1 ·
Borja Lorenzo avatar image Borja Lorenzo Felix Möhlmann commented ·

Thanks.
I didn't know about the syntax for ternary operators. It's really interesting.
Your answers are very helpful. I'm learning a lot.

Sincerely,
Felix
Attached are the nice results of my graphs, like I wanted them.
1722578083321.png

0 Likes 0 ·
1722578083321.png (61.0 KiB)