question

Oscar Perez avatar image
0 Likes"
Oscar Perez asked Jordan Johnson commented

time table counting time

@phil.bobo

Philp one question, can you help me to make a small script to count the hours in the time tables...

For example I have a daily time table, and its important to count how many hours its my line working, this parameter is important to put as a constrain in the Opquest.

So, for instance I make some hours schedule down , or lunch time. So at the end I have only 22.4 hours available in my Line (due to my planned down times), so my objetive with the Optquest its to bit this time! so I need as a constrain.

It is possible to make a scrip code for this ?

Can you make an example?maclas-nov-23.fsm

FlexSim 16.2.2
time tables
maclas-nov-23.fsm (311.6 KiB)
5 |100000

Up to 12 attachments (including images) can be used with a maximum of 23.8 MiB each and 47.7 MiB total.

Adrian Haws avatar image
0 Likes"
Adrian Haws answered

Oscar,

I wrote a bit of code in your OnRunStart model trigger that gets the operational time for each time table by referencing the model tree. I set it up to fill column 1 of the "Resultados" table (in hours). See attached model and let me know if you have any questions.


5 |100000

Up to 12 attachments (including images) can be used with a maximum of 23.8 MiB each and 47.7 MiB total.

Jordan Johnson avatar image
0 Likes"
Jordan Johnson answered Jordan Johnson commented

I made you an example solution. It's attached to this answer. Here's how it works:

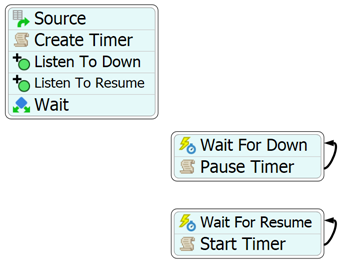
First, I made a Fixed Resource Process Flow, and then I attached that flow to all of the time tables (you can attach a process flow to anything with object data). The purpose of this flow is to listen to the up and down events of the time tables. The process flow looks like this:

The Scheduled Source creates a token for each table. That token creates a TrackedVariable on a label called Timer. The TrackedVariable is a Kinetic tracked variable, meaning it can have a rate.

Then the token creates two children; one child listens for down events, and the other listens for resume events. When a down event happens, the child sets the rate on the label to 0. When a resume event happens, that child token sets the rate on the label to 1.

What this means is that there is a tracked variable for each time table, continually summing the amount of time it is up.

To use this value in the experimenter as a performance measure, you can use this code:

return getlabel(gettoken(node("Tools/TimeTables/L8", model()), "Wait", 1), "Timer");

This code gets the current value of the label, which is the total "running" time.

maclas-nov-23-updated.fsm


· 3
5 |100000

Up to 12 attachments (including images) can be used with a maximum of 23.8 MiB each and 47.7 MiB total.

Jordan Johnson avatar image Jordan Johnson ♦♦ commented ·

This solution works, even if the time table changes during the model run.

0 Likes 0 ·
Oscar Perez avatar image Oscar Perez commented ·

@jordan.johnson Thanks, Jordan, something is missing because when I track this value, return less time that the one that I have in the tables...

0 Likes 0 ·
Jordan Johnson avatar image Jordan Johnson ♦♦ Oscar Perez commented ·

That makes me wonder if there are overlapping events on a single table. If that is the case, then the tracked variable would be "turned off" prematurely.

0 Likes 0 ·