question

Akshay P avatar image
0 Likes"
Akshay P asked Shankar Narayan answered

Waiting time vs Processing time for an object

Dear all,

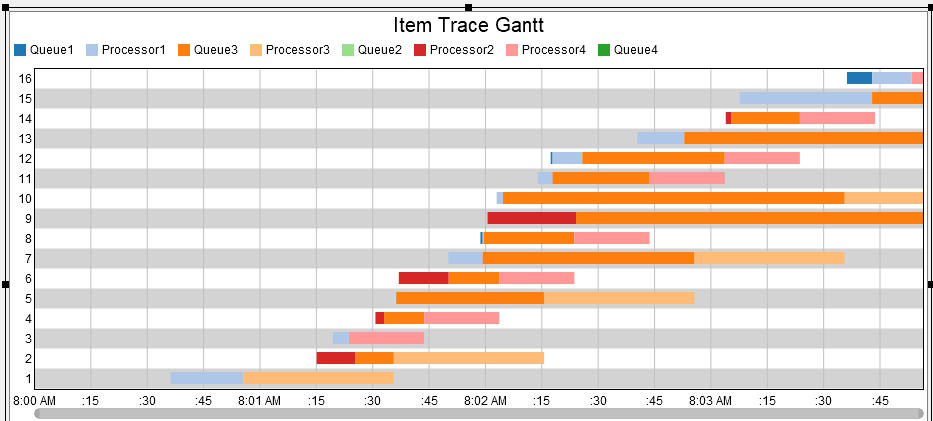
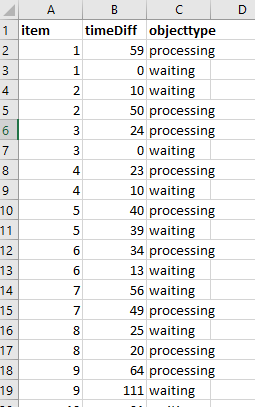
I would like to obtain the statistics regarding the waiting time vs processing time for all my flow-objects in my simulation. I have been reading up in the forum as well as the manual and I have only found state charts (but they seemed to be more focused on TEs as well as fixed resources, but not the objects that are being processed by them).

Can someone tell me which statistics can help me with the above stated problem?

Regards,

Akshay Pundirstatic-tandemadjusted.fsm

FlexSim 19.1.2
dashboardssimulationprocess timestatswaiting times
5 |100000

Up to 12 attachments (including images) can be used with a maximum of 23.8 MiB each and 47.7 MiB total.

tannerp avatar image
0 Likes"
tannerp answered Akshay P commented

Hi @Akshay P,

This is a great question. I don't currently know of any templates that do this within the software, and our resident statistics expert is not in the office today, but here's my best attempt at a solution.

I used an Item Trace Gantt chart, which shows where the flow items are at different times in the simulation and looks like the image below.

This chart creates a standard Statistics Collector with time values we can use to calculate the waiting time and processing time. The only thing that's missing is we don't know which objects represent either "waiting" or "processing." To include this, I simply put a binary label called "timeType" on each of the queues and processors that indicated whether the object was a 0 - "waiting" or 1 - "processing" type object.

Opening up the statistics collector through the tree as shown below, we can add a data tracker on this "object type" label that listens to the event object and checks the label to see if the item just finished waiting or processing.

From the Stats Collector Properties window, we can go to the General tab and click Export Table after a model run to collect all the data in a CSV file.

I couldn't find a good way to aggregate and show this data in FlexSim (I couldn't find a function to calculate the difference in dates), so I took the raw data (shown below) and ran a sql query to aggregate the data to what we need.

The SQL Query I used was the following:

SELECT item, SUM(DATEDIFF(starttime,endtime,"second")) AS timeDiff, objecttype
FROM time_type_test
GROUP BY item, objecttype
ORDER BY item

The results came out to look like this:

As you can see, we now have data that we can work with to see how much time each item spent waiting vs processing. To explain each column:

1) The "item" column is just the number of the item that entered the system in chronological order.

2) The "timeDiff" column is the SUM of the calculated DIFFERENCES between start and finish times GROUPED BY the type of time, whether "waiting time" (=0) or "processing time" (=1).

3) The "objecttype" column tells us whether the object that the flow item entered/exited was a "waiting" type or a "processing" type object.

I know this is a bit of external work to get this data, so hopefully we can find a way to get this within FlexSim, but for now, maybe this will help. Let me know what feedback you have...

Here's the model I used for reference:

time-flow-items.fsm


· 15
5 |100000

Up to 12 attachments (including images) can be used with a maximum of 23.8 MiB each and 47.7 MiB total.

tannerp avatar image tannerp commented ·

Additionally, after throwing the SQL Query result back into Excel and running a simple Find and Replace, the data we get looks like this:

0 Likes 0 ·
Akshay P avatar image Akshay P commented ·

Dear @tanner.p,

Thank you for your detailed response and apologies for the late response. I was not able to log into the community due to some unknown reason.

So I went through the answer and applied the same logic, but there is an essential difference between our models. You have a free flowing line where there is an immediate transfer from the processors to the queue (because of which you have assigned the queue a label value of 0), where as in my model I have some waiting at the machine as well (until a robot is free to pick up the product/object from it) and waiting at the queue.

Maybe you can give my model a look and tell me if I am right? The model is attached in the question. Also, can you inform me on how to run SQL queries on FlexSim? I have never done that before, so I have no idea how you ran the one you have mentioned above.

Apart from that, this solution seems quite on point.

Please let me know your thoughts on this and thanks again for the help :)

Regards,

Akshay Pundir

0 Likes 0 ·
tannerp avatar image tannerp Akshay P commented ·

Hi @Akshay P,

Thanks for the feedback. We spent some time digging into the model you've attached and as we were doing so, we noticed that there are a few bugs with the model that might prevent us from getting the statistics you're looking for.

One of the issues doesn't affect the model too much, but it's worth noting: Each of the robots have an On Load trigger that uses items "Type" labels to look up the capacity for that item in a Global Table. There is an item type 3 that is attempting to look at row 3 in the table, but this row doesn't exist. For this reason, you'll need to either bundle the table and look up the value "3" in column 1 or upgrade to FlexSim 19.2 where there's a function called "getValueByKey" that will search the table for the value "Type".

With that resolved, the next issue is that it looks like the Robots are loading and moving some of the items before they have finished processing. We might have to create some kind of buffer that makes sure the items are done processing before a robot is allowed to move the item. I'm not sure if this is really what's happening, so maybe you could explain how the task list is functioning. I've got a screenshot of the task list to help illustrate my question:

At the this time, the Magazine with product_ID "70" is waiting at Oven1 in the 3D model. At the same time, there is a task in the list that is going to attempt to move the Magazine with product_ID "70" (highlighted in red box) from DA2 to Robot1. This means that the Task Executer is going to travel to DA2 but load from Oven1. Am I misinterpreting this or do you think this is something we need to fix? This is happening consistently in the model where the Task List thinks objects are in a different spot than they actually are.

Assuming everything works correctly, I think we can go a different route on setting up statistics. We will assume that Process Flow is synchronized with what's actually going on in the 3D. Then we listen to the creation of the items. Then we will used a tracked variable on the items to indicate when the items are processing (listen for unload at processor and on process finish) and then we'll log the data as "time spent processing / time in model" or something of the like. That way, we'll get accurate statistics based on Process Flow.

For now, let's focus on getting the model to function accurately. If you could help me understand the task list, that would be a great place to start.

0 Likes 0 ·
Akshay P avatar image Akshay P tannerp commented ·

Dear @tanner.p,

Thank you so much for your feedback and the indepth analysis of my model. I shall answer both your queries below -

1) Yes, I am aware of that and I will fix it. I actually didn't have the data on the buffer capacities of the robots for the "type 3" product (i.e. a cassette). I forgot that I had labelled it, so thanks for pointing that out. I will fix that issue once I have those numbers and will keep your tip in mind :)

2) The second issue was unknown to me, so thanks for pointing that out. I actually included some intermediate buffers in the model as well as my schedule (named "Queue 1" and "Queue 2" in the 3D model. I had also modified my input data to suit that inclusion (as seen here). So the tasks for the product "70" should be executed as follows -

As you have pointed out in your analysis, the product is in Oven1 where as it is supposed to be at the DA1, which should NOT be the case. Can you tell me what could be the exact reason behind this? I am not able to understand why that would happen.

I hope I have informed you sufficiently here. Just to sum it up, according to my 3D model, the products should move in one direction, from one loop to the other (left to right), while stopping at the intermediate queues to wait there until a TE picks it up.

Please let me know if anything is not clear and I will get back to you as soon as possible.

Thanks again for all the help!

Regards,

Akshay Pundir

0 Likes 0 ·
Show more comments
Shankar Narayan avatar image
2 Likes"
Shankar Narayan answered

Hello @Akshay P

Can this original question not be answered simply by using Milestone charts? We use that a lot to paint the various Sankey diagrams which is essentially tracking flow items through it's life cycle in the system at various stages. Each milestone captures all the stats you want and the Sankey is a great way to tell the story. Not sure if this applies to your specific model situation.

5 |100000

Up to 12 attachments (including images) can be used with a maximum of 23.8 MiB each and 47.7 MiB total.

Write an Answer

Hint: Notify or tag a user in this post by typing @username.

Up to 12 attachments (including images) can be used with a maximum of 23.8 MiB each and 47.7 MiB total.