question

MarcPost avatar image
0 Likes"
MarcPost asked Jordan Johnson answered

Problem with "Output By Hour By Type" Dashboard since v20.1

Hello,

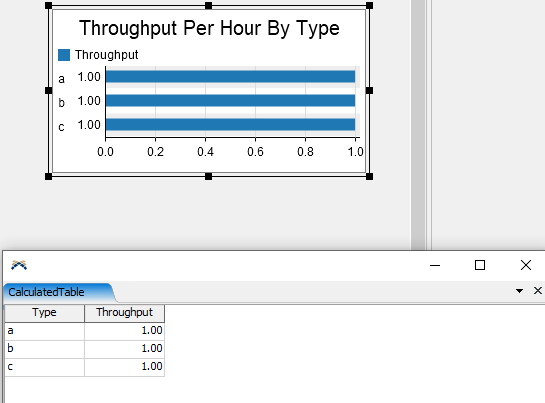
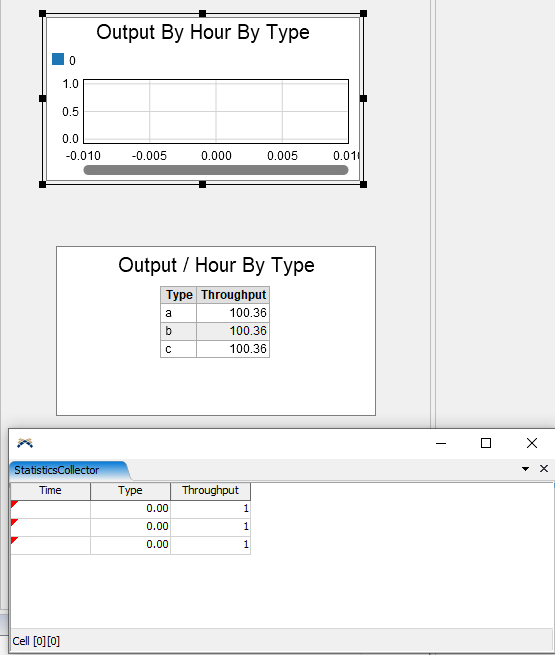
Since the update to version 20.1 I have a problem with the new Output Dashboard (old Throughput), specifically with "Output By Hour By Type" for Text labels.

I updated a model created in version 20.0 and the charts have stopped working, even if I create them again. Any idea?


Thanks a lot!

v20.1 Output Dashboard Problem.fsm

FlexSim 20.1.0
flexsim 20.1.0
5 |100000

Up to 12 attachments (including images) can be used with a maximum of 23.8 MiB each and 47.7 MiB total.

tannerp avatar image
0 Likes"
tannerp answered

Hi @MarcPost,

There is a fundamental difference in the way these statistics are collected that I believe is part of @Jordan Johnson's update for 20.1. He might be able to elaborate on this.

In 20.0, the "Throughput Per Hour By Type" Chart relied on a Calculated Table by default that divided the total throughput grouped by "Type" by the time the model had been running each hour. The results of the Calculated Table look like this in 20.0:

When we compare this to 20.1, we'll find that the "Output Per Hour By Type" Chart now relies on a Statistics Collector rather than a Calculated Table. The Statistics Collector collects the Throughput and Type data, but it doesn't aggregate it like it should. @Jordan Johnson could probably explain whether this was intentional or not.

For now, you might be best off creating a new Statistics Collector that will listen to the Processor and aggregate the throughput data according Type.


5 |100000

Up to 12 attachments (including images) can be used with a maximum of 23.8 MiB each and 47.7 MiB total.

Jordan Johnson avatar image
0 Likes"
Jordan Johnson answered

Yes, this is a bug in the new version. I'll add it to the bug list.

The bug applies when you are using a text label in this chart. For now, you'll either have to use a number label, or you can install the chart, and set the "Object" column in the statistics collector to use a double or integer storage type. Also, be sure that the "Time" column is set to a number datatype.

The bug is that instead of changing the storage type of the Object column, the chart currently changes the format of the Time column.

5 |100000

Up to 12 attachments (including images) can be used with a maximum of 23.8 MiB each and 47.7 MiB total.

Write an Answer

Hint: Notify or tag a user in this post by typing @username.

Up to 12 attachments (including images) can be used with a maximum of 23.8 MiB each and 47.7 MiB total.