Idea

Mischa Spelt avatar image
6 Likes"
Mischa Spelt suggested Jordan Johnson commented

Filter zero-duration changes in Gantt chart

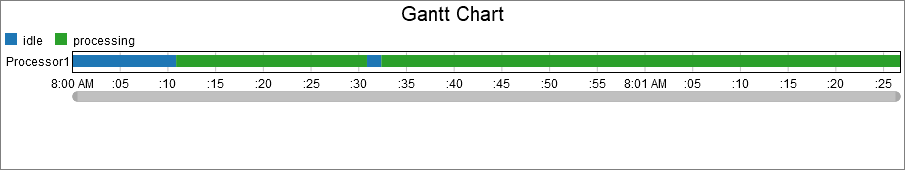
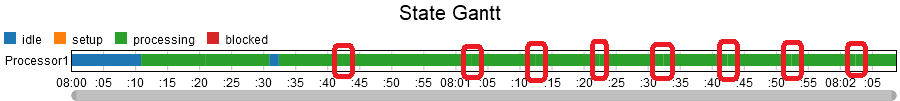
When plotting a Gantt chart, any state changes with zero duration cause a break in the bar.

Visually this is not appealing because it will cause subtle white lines:

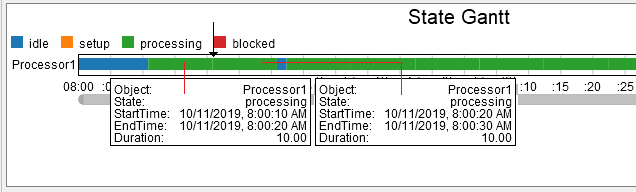
but it also makes it harder to see how long the object has actually been in that state. For example, how long has the processor worked between the initial and second idle time?

Unfortunately it is not always possible to avoid the state changes being logged in the first place, so currently the only way around this is to add a Calculated Table on top of the Statistics Collector (which I haven't tested in 19.2.2. but used to break when the Statistics Collector table was empty at the start of the model).

Hopefully you can change the Gantt chart to automatically combine such rows into a single bar.

For completeness, here is a demo model: gantt-zeroduration-states.fsm

statistics collectorgantt chartstate statisticsstate gantt
5 |100000

Up to 12 attachments (including images) can be used with a maximum of 23.8 MiB each and 47.7 MiB total.

1 Comment

·
Jordan Johnson avatar image
0 Likes"
Jordan Johnson commented

The blocks are broken up because the state of the processor is broken up. The processor wasn't processing for a solid 20 seconds. It was processing an item for 10 seconds, then immediately began processing a second item for another 10 seconds. Even in this simple case, merging the data would obscure the fact that the processor switched items. If the bar was simply 20 seconds long, you would not be able to tell if the processor was working on a single long job or on two short jobs. This seems like very important information.

Showing the separate bars also exposes how the 3D objects deal with state. They really do change state, even if it's for zero time. I'm not inclined to make it look like they don't change state as much as they do.

The gantt chart is also not just for drawing state. It draws whatever gantt-like data the user chooses to collect. I suspect that it is usually important that two same-colored bars on the same row are, in fact, two separate bars, and not a single bar, even if one starts exactly where the other ends.

So all that being said, you can always just collect "fuzzier" state data. You can use a process flow like the one in the attached model to ignore zero-time states. That way, the gantt chart isn't obscuring data; that data was simply never collected in the first place.

gantt-invisible-states.fsm

· 3
5 |100000

Up to 12 attachments (including images) can be used with a maximum of 23.8 MiB each and 47.7 MiB total.

Patrick Zweekhorst avatar image Patrick Zweekhorst commented ·

Hi @jordan.johnson,

I agree with your comments about the 10 seconds states. You don't see that information anymore with the second gantt chart. In some cases however the second gantt chart might also be useful. We looked at your example model and it works good, we do have one question about the stats collector you used.

You are using the option unique row values, with as row value "token". However, there is only 1 unique token going through the flow. How are the rows created? We double checked ( with printing data.token in one off the columns ) and there only is 1 token.

Thanks for the help,

Patrick

0 Likes 0 ·
Patrick Zweekhorst avatar image Patrick Zweekhorst Patrick Zweekhorst commented ·

Found it,

We overlooked the Edit row tracking options..
We never used that option, but it looks like a power full feuture

0 Likes 0 ·
Jordan Johnson avatar image Jordan Johnson ♦♦ Patrick Zweekhorst commented ·

Glad you found it, it is a very nice feature. When you "stop tracking" a row value with an event, everything fires as normal for the event, and any always columns are updated. After that happens, though, then the Statistics Collector "forgets" about the row value. Any always columns are locked where they were, and if the same row value shows up in another event, it gets a new row in the table.

0 Likes 0 ·

Write a Comment

Up to 12 attachments (including images) can be used with a maximum of 23.8 MiB each and 47.7 MiB total.

Your Opinion Counts

Share your great idea, or help out by voting for other people's ideas.