question

Chitra Z avatar image
0 Likes"
Chitra Z asked Joerg Vogel edited

How To make individual state % stats visible on bar chart type dashboard?

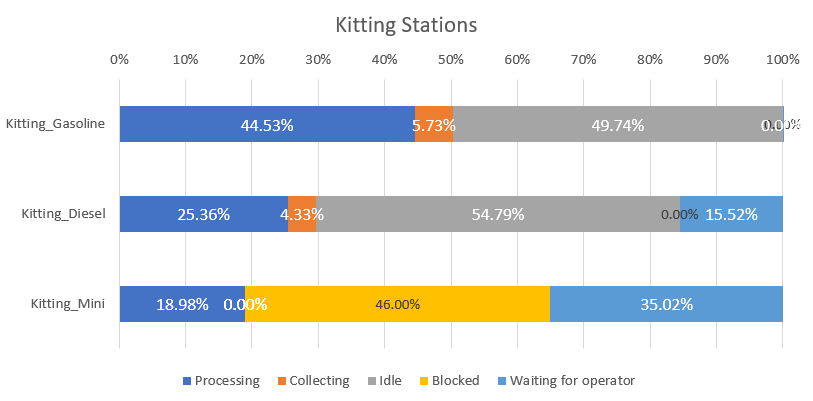
I want to make each state % utilization visible in bar chart dashboard like below.

is there any option we can see chart like this in flexsim?

Flexsim currently gives total utilization on Y Axis, instead I want to see each state % utilization like below.

FlexSim 21.1.0
dashboardsflexsim 21.1.0charts
1619632063258.png (25.6 KiB)
5 |100000

Up to 12 attachments (including images) can be used with a maximum of 23.8 MiB each and 47.7 MiB total.

Jordan Johnson avatar image
1 Like"
Jordan Johnson answered Joerg Vogel commented

Hi Chitra,

Showing the percentages on top of the bars like that isn't currently possible. I can add it to the dev list as a request. You can hover over the bars to see their value, but it doesn't sound like that's quite what you're looking for.

· 3
5 |100000

Up to 12 attachments (including images) can be used with a maximum of 23.8 MiB each and 47.7 MiB total.

Joerg Vogel avatar image Joerg Vogel commented ·

@Jordan Johnson, is there still the possibility to attach a html driven FlexScript enhanced dashboard widget?

0 Likes 0 ·
Jordan Johnson avatar image Jordan Johnson ♦♦ Joerg Vogel commented ·

Yes, the HTML widget in the library is still good.

1 Like 1 ·
Joerg Vogel avatar image Joerg Vogel Jordan Johnson ♦♦ commented ·

Many thanks, for your comment!

0 Likes 0 ·
Arun Kr avatar image
0 Likes"
Arun Kr answered Joerg Vogel edited

Check the stack bars option in the chart settings.


1619635182098.png (375.9 KiB)
1619635259037.png (131.0 KiB)
· 5
5 |100000

Up to 12 attachments (including images) can be used with a maximum of 23.8 MiB each and 47.7 MiB total.

Chitra Z avatar image Chitra Z commented ·

Thanks @Arun KR for your help. But when we check stack bars in settings, we see total utilization excluding idle time (22.22%) on Y Axis.

I want to show individual state % on bar itself like below image.

let me know if any way to do so.

0 Likes 0 ·
dashboard.png (304.0 KiB)
Arun Kr avatar image Arun Kr Chitra Z commented ·

When you hover your mouse over the bars in the chart the utilization will pop up. But I am not sure of this display that you asked for. Is it possible @Jordan Johnson?

0 Likes 0 ·
Jason Lightfoot avatar image Jason Lightfoot ♦ Arun Kr commented ·

@Jordan Johnson Can the user edit someting in javascript to do something quickly? I'll add it as a request to the dev list.

0 Likes 0 ·
Show more comments

Write an Answer

Hint: Notify or tag a user in this post by typing @username.

Up to 12 attachments (including images) can be used with a maximum of 23.8 MiB each and 47.7 MiB total.