Hello,
How can I change the pie chart percentage from 100% to the processing state percentage?
Hello,
How can I change the pie chart percentage from 100% to the processing state percentage?
Hi @Clara,
Thank you for contributing to our community! We couldn't identify a maintained license or subscription linked to your account.
You may need to update your profile information to identify yourself as a license owner or their associate. Check out our article for how to ensure you receive timely support. If you update your profile comment back to let us know - we'll adjust the priority of your post accordingly.
If your current license is expired, please contact your local distributor to renew.
Hi, Clara. The states that are considered for the percentage are defined in the StateTable. You can modify them:
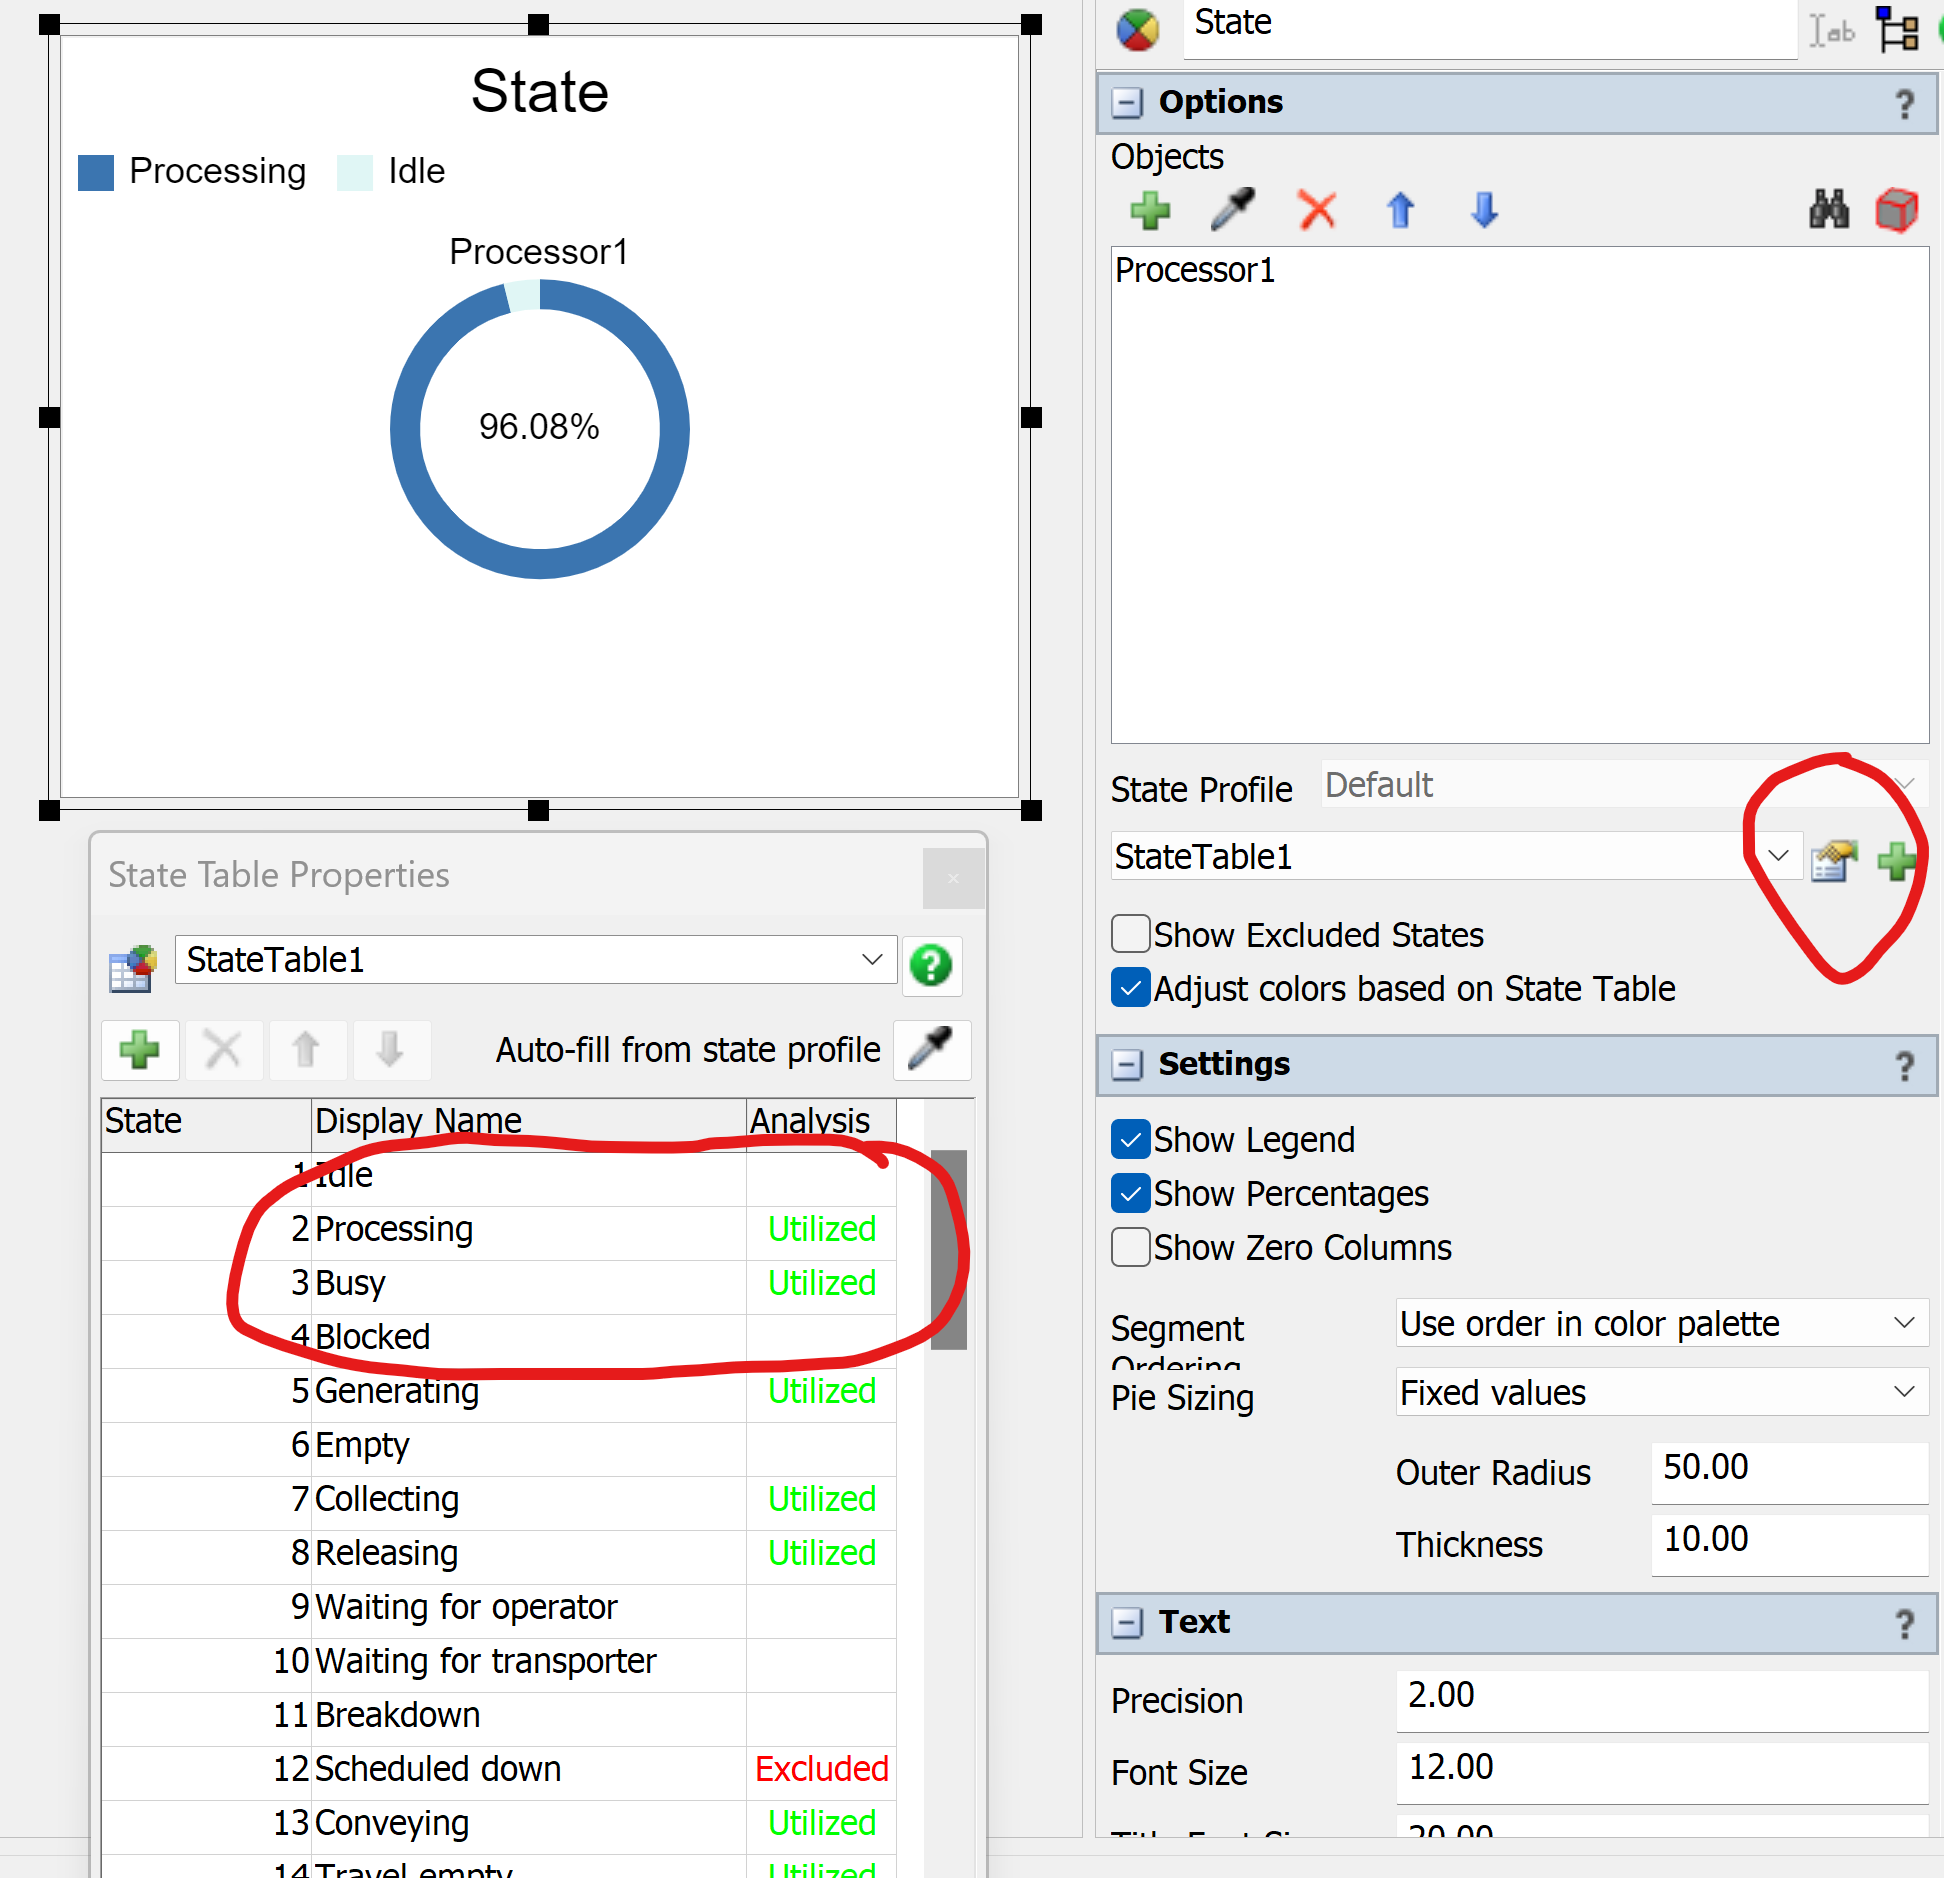
In your graph, the cells for the states Blocked and breakdwon should be blank so that they are not considered in the percentage.
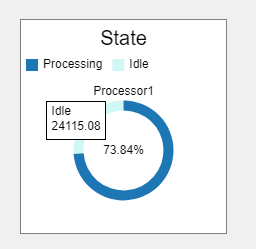
The Pie Chart always treats the sum of all shown values as 100%. For example the data behind the state chart is actually just the raw time spent in each state which gets then converted to a percentage.
You can see this by unchecking the "Show Percentages" option in the chart's properties.
So to change the 'base', create a state table that excludes any state you do not want to see represented in the chart. (By default, "Off Shift" and "Scheduled Down" are ignored, for example). The remaining states will be counted as 100%.
The graphs always show 100% and I need them to show me the percentage of time they are "processing"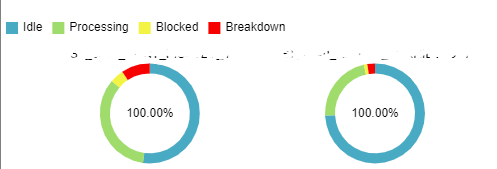
Hello @Clara,
In the state chart you mark the utilized option for the ones you want to contribute to the percentage. 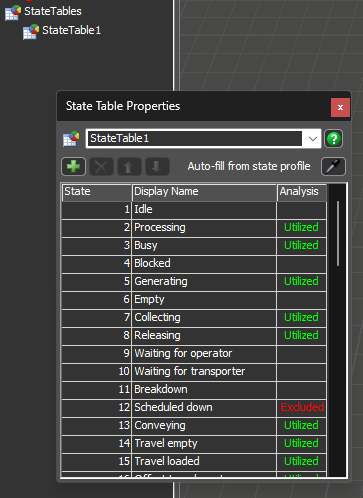
18 People are following this question.
FlexSim can help you understand and improve any system or process. Transform your existing data into accurate predictions.
FlexSim is a fully 3D simulation software environment. FlexSim can be used to simulate any process in any industry.
FlexSim®, FlexSim Healthcare™, Problem Solved.®, the FlexSim logo, the FlexSim X-mark, and the FlexSim Healthcare logo with stylized Caduceus mark are trademarks of FlexSim Software Products, Inc. All rights reserved.