question

Jacob E2 avatar image
0 Likes"
Jacob E2 asked Jacob E2 commented

Use Dashboard Table Chart to display downtime of a conveyor

I would like to use a Dashboard Table Chart to display downtime of a conveyor. The conveyor down time in my model is caused by two separate motors stopping conveyors as flow items enter and exit the audit area. I tried to achieve this by using a state pie chart, which got me close to what I needed. With the state pie chart, I'm able to see the amount of downtime by hovering over the red portion of the pie, but I would rather have the time displayed in a table. So then, I installed the pie chart template and tried using the "Enter Audit" Statistics Collector generated from the pie chart to create a table chart using the data from that statistics collector. This got me what I needed, but now I have all these extra states that I don't want to see in the table.

So how do I get rid of all of the unwanted states? I only want my table chart to display the same states as the pie chart - empty, conveying, and down.

conveyordowntime.png

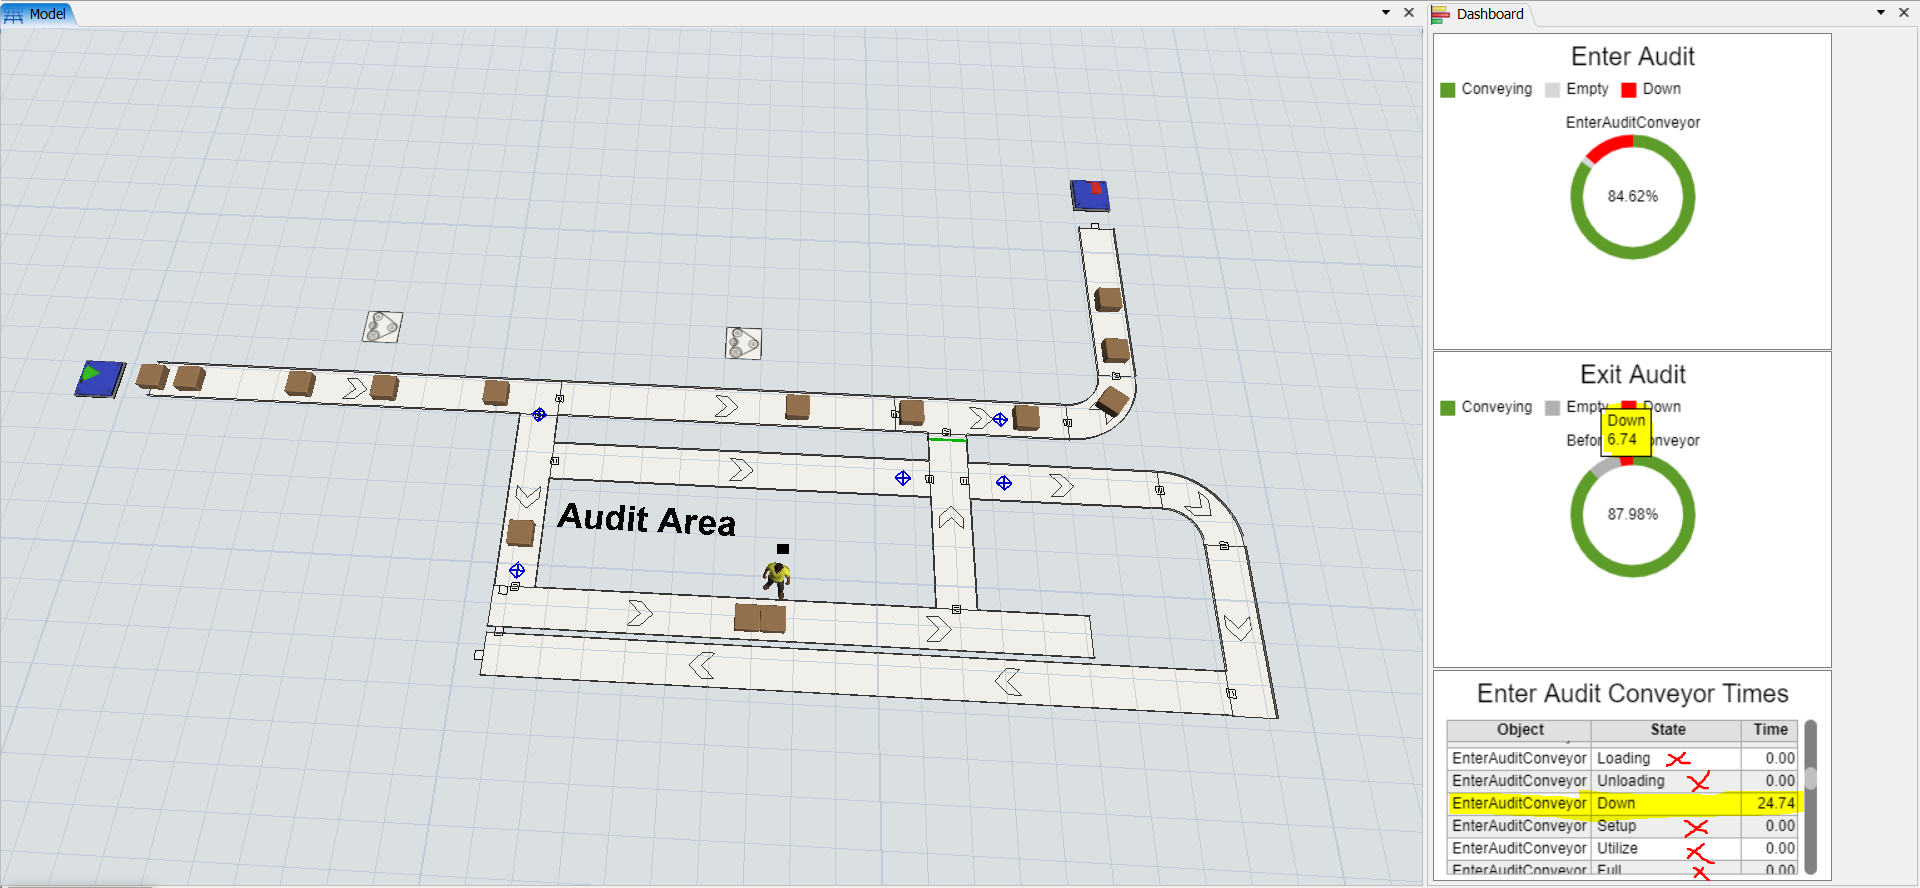
Additionally, is it possible to sum up the total down time of multiple conveyors into one table? For example, is there a way to use one table to sum the down time of the conveyor entering the audit area plus the down time of the conveyor that shuts down as items exit the audit area.

Track Conveyor Downtime .fsm

FlexSim 21.0.6
conveyorstate chartdown time
5 |100000

Up to 12 attachments (including images) can be used with a maximum of 23.8 MiB each and 47.7 MiB total.

1 Answer

·
Felix Möhlmann avatar image
1 Like"
Felix Möhlmann answered Jacob E2 commented

I see you have already "installed" the components of the "Enter Audit" graph to access the statistics collector in the dashboard table.

In the properties of the corresponding statistics collector, you can set a condition that the triggering event has to fulfill to be counted. To only take the three mentioned states in account it would be

// By state number
data.token.State == 6 || data.token.State == 13 || data.token.State == 20

or

// By state name
data.token.StateName == "Empty" || ...

The statistics collector listens to a process flow, that has one token per state. The code means that only tokens belonging to the mentioned states trigger the collector.

You can get the total time in a state of multiple objects in a similar way. Add a "Composite State" chart and add the respective conveyors. Then install its components. One of them will be a (pretty much identical) statistics collecter in which you can exclude unwanted states as above. Another component is a calculated table which aggregates the data from the collector for all objects. The table it generates is displayed in its properties window.

track-conveyor-downtime_1.fsm


· 1
5 |100000

Up to 12 attachments (including images) can be used with a maximum of 23.8 MiB each and 47.7 MiB total.

Jacob E2 avatar image Jacob E2 commented ·

Thank you so much for your help, Felix!

This did exactly what I was wanting it to do, and I was able to incorporate it into my larger model quite easily.

0 Likes 0 ·

Write an Answer

Hint: Notify or tag a user in this post by typing @username.

Up to 12 attachments (including images) can be used with a maximum of 23.8 MiB each and 47.7 MiB total.