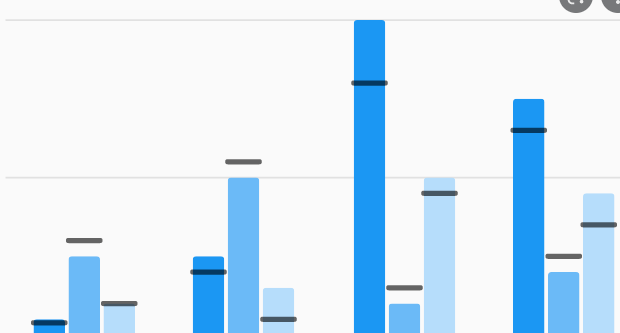
Hi, is there any chart to visualize KPIs versus predefined targets?
Something like this:
Thank you,
Lambert
The closest I could come up with is a stacked bar chart in which the bar sizes are calculated so the end position of a 'target bar' stays constant. To show the 'value', you'd use two distinct bars. One to show the value if it is below the target (this will get set to zero ones the value surpasses the target) and one if it is above (this is zero as long as the value has not reached the target). This allows the order of the 'value' and the 'target' bar to switch when the value increases/decreases past the target. It also allows to choose different colors.
 The statistics collector feeding this chart just needs access to the current KPI value and the corresponding target for each row.
14 People are following this question.
FlexSim can help you understand and improve any system or process. Transform your existing data into accurate predictions.
FlexSim is a fully 3D simulation software environment. FlexSim can be used to simulate any process in any industry.
FlexSim®, FlexSim Healthcare™, Problem Solved.®, the FlexSim logo, the FlexSim X-mark, and the FlexSim Healthcare logo with stylized Caduceus mark are trademarks of FlexSim Software Products, Inc. All rights reserved.