question

hermione12 avatar image
0 Likes"
hermione12 asked hermione12 commented

Collect values from statistical distribution

Hello,

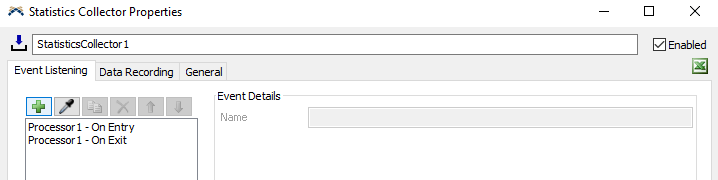
I have a query regarding statistical distribution, I want to record the distribution value assigned for each item being processed out of a processor.

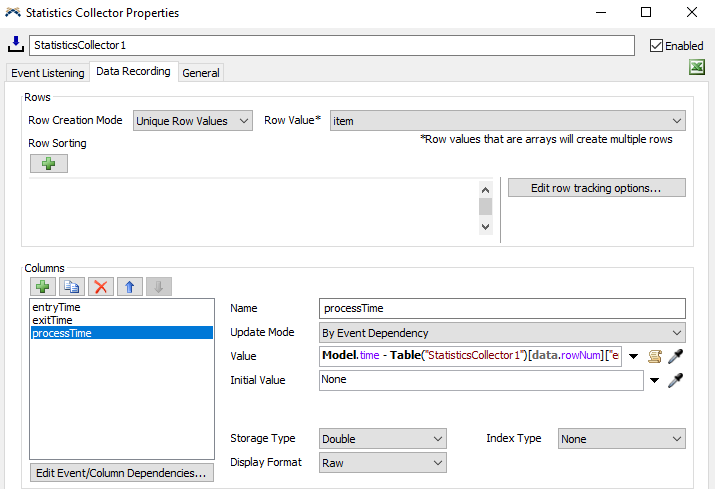
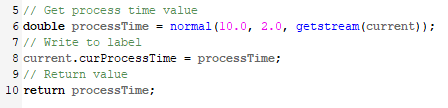
Suppose I use normal distribution, then I want to record values for each part from the distribution range. Basically, I want to know the distribution value or process time assigned for each part.

How to do this?

model.fsm

FlexSim 20.0.10
flowitemsstatistical distributionrecord values
model.fsm (26.3 KiB)
5 |100000

Up to 12 attachments (including images) can be used with a maximum of 23.8 MiB each and 47.7 MiB total.

1 Answer

·
Felix Möhlmann avatar image
0 Likes"
Felix Möhlmann answered hermione12 commented

The attached model contains two examples of how you can collect that data.

StatisticsCollector1 works the same as the Alessio Merlo's model from this post. It measures the time the items spend on the processor by listening to its entry and exit event. When an item enters, a new row is created in the collector's internal table with the item as the 'rowValue'. The row value is an identifier for a row. If another row would be created with the same row value, the collector will instead update the already existing row.

1658388694521.png1658388709779.png

When the row is first created when the item enters the combiner, the entry time is written to the first column. When the item exits, the second and third column are updated (which is why the 'rowValue' is used) to store the exit time and the difference between the two - the process time. The process times can then the displayed in a histogram chart.

StatisticCollector2 instead listens to the 'process time' event of the processor, the moment the process time is determined. The process time option was edited so it doesn't just return the value of the chosen distribution but also writes that value to a label on the processer first.

1658388673005.png

This label is then read by the statistics collector. Both statistics collector will in most cases store the same data. The difference is that values will be added to the second one as soon as the process starts, whereas the first one has to wait for the process to finish. The measured times of the first one would also include breakdowns of the processor. So if you are only interested in the output of the statistical distribution, the second option is better.

distribution_histogram_fm.fsm

For more information about statistics collectors, please refer to the manual.


· 3
5 |100000

Up to 12 attachments (including images) can be used with a maximum of 23.8 MiB each and 47.7 MiB total.

hermione12 avatar image hermione12 commented ·
Thank you @Felix Möhlmann

I have a query, if I want to store the values collected from this variable curProcessTime and store in excel. How to do this?

0 Likes 0 ·
Felix Möhlmann avatar image Felix Möhlmann hermione12 commented ·

Open the table and directly copy/paste the data into excel.

1658400666988.png

Or set up an export in the Excel Import/Export Interface. You can automate this by first setting up the export, then starting it in code with the 'excelmultitableexport()' command.

1658400627996.png

0 Likes 0 ·
1658400627996.png (30.4 KiB)
1658400666988.png (18.0 KiB)
hermione12 avatar image hermione12 Felix Möhlmann commented ·
Thank you , it was really helpful
0 Likes 0 ·

Write an Answer

Hint: Notify or tag a user in this post by typing @username.

Up to 12 attachments (including images) can be used with a maximum of 23.8 MiB each and 47.7 MiB total.