Hello,
I want to count WIP By Type that some are pallet and some are items on pallet.
How to modify the Statistics Collector to display both type 1 and type 2 on one chart?
Filename on FlexSim Cloud = "Count WIP by type on pallets.fsm"
Hello,
I want to count WIP By Type that some are pallet and some are items on pallet.
How to modify the Statistics Collector to display both type 1 and type 2 on one chart?
Filename on FlexSim Cloud = "Count WIP by type on pallets.fsm"
Don't your charts already do that?
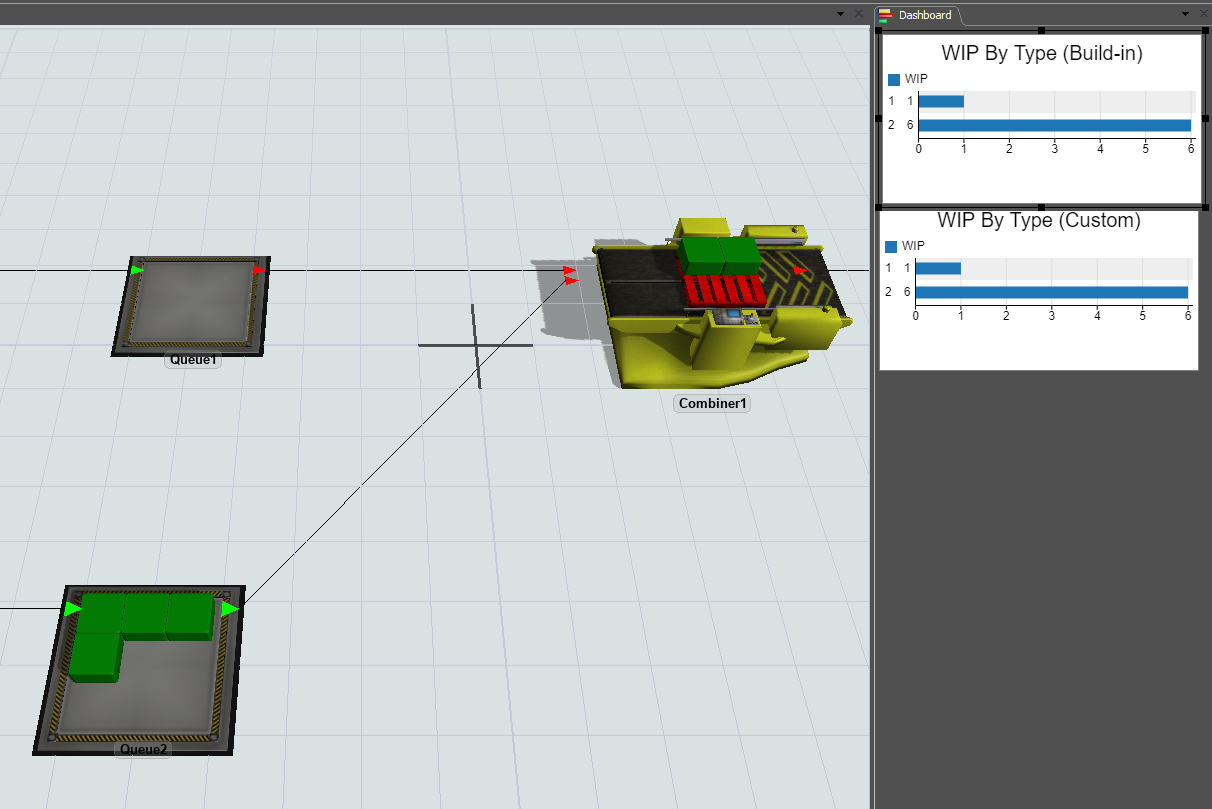
The "1" column represents the number of pallets you have, while the "2" represents the number of boxes you have in the system. If not, please be more specific.
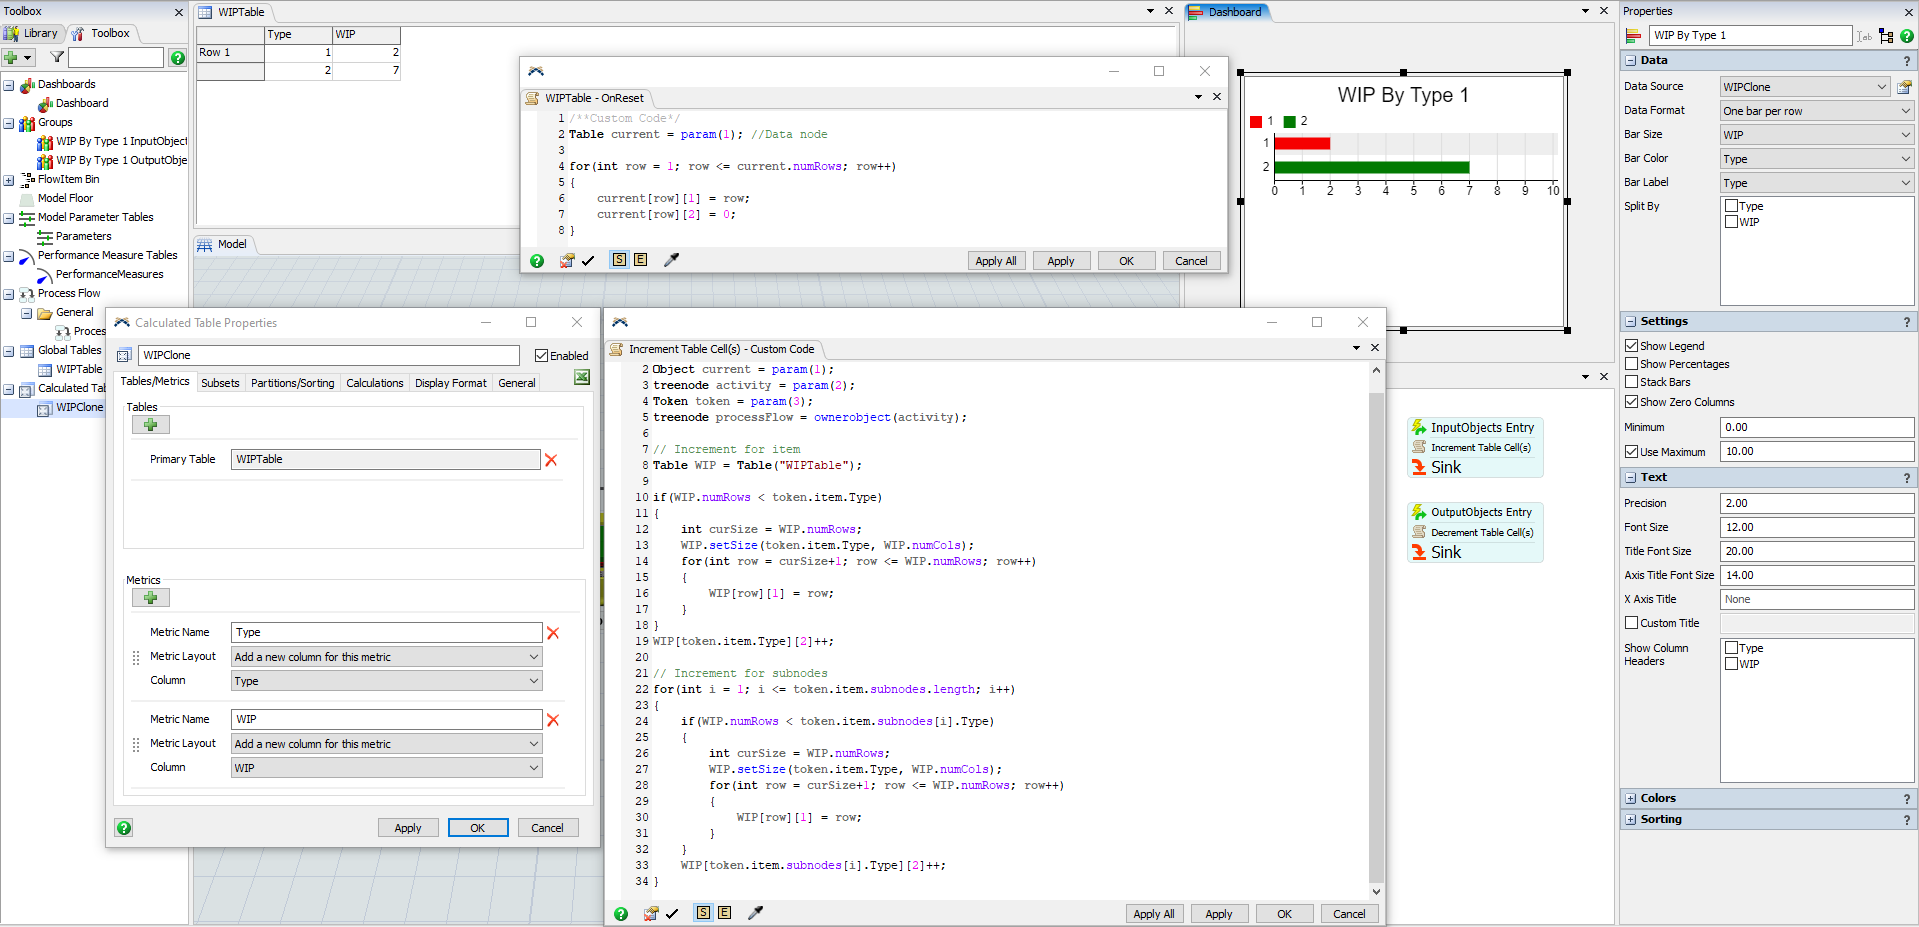
It's probably easier to keep track of the WIP values in a global table than with a statistics collector when container items are involved due to two reasons.
1) There is no event that directly references the items on the pallet when the pallet enters an object. The statistics collector can only update one row at a time though. So if multiple types are involved, you'd need multiple events (or write all types into a single row as columns).
2) You cannot write to the internal table of statistics collector directly.
With a global table you can emulate the function of a statistics collector by listening to the On Entry event of the Input and Output objects in a process flow. In a custom code activity you can then increment/decrement the table values for the item itself and any subnodes it might contain at the same time.
To display the values in a dashboard, have a calculated table copy the global table and use it as the data source for the chart.
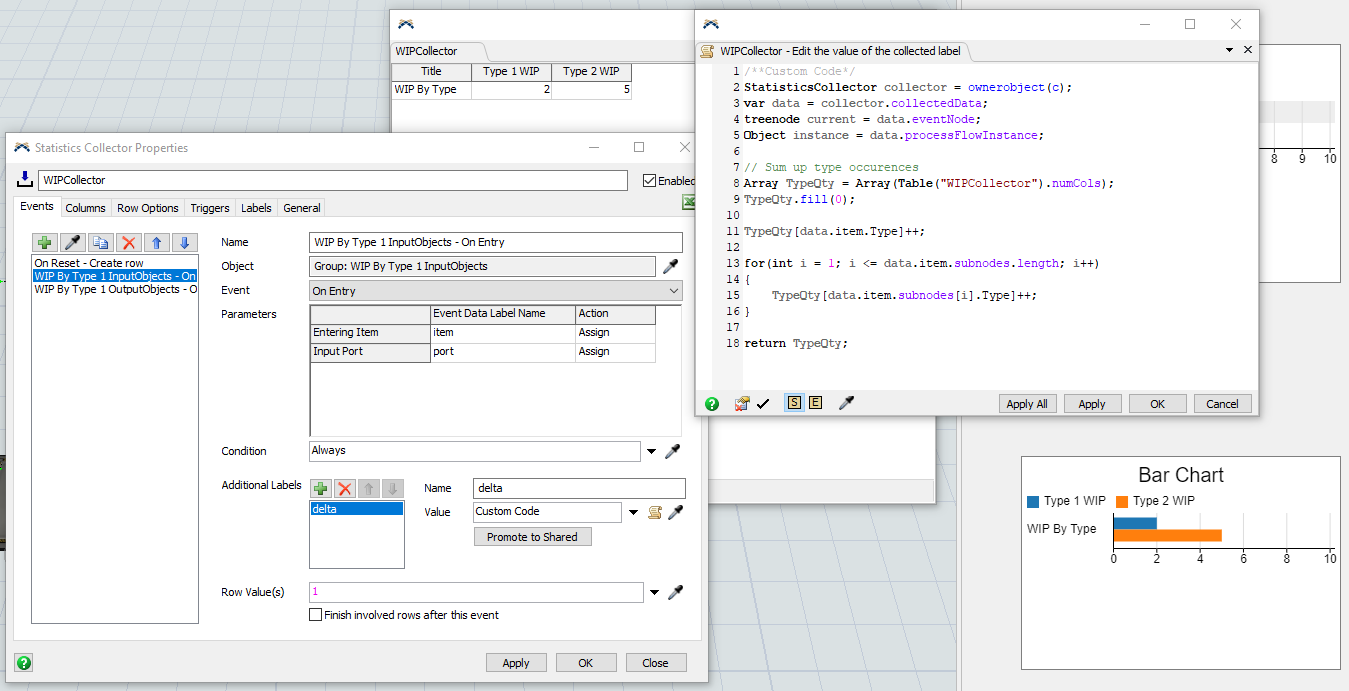
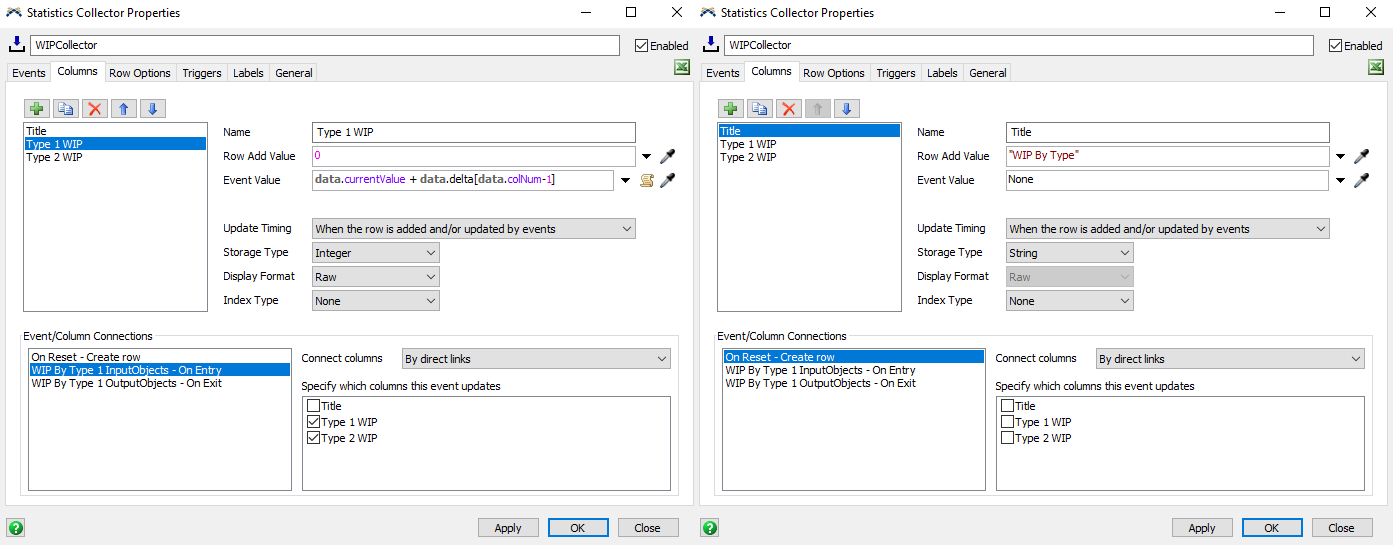
If you do want to use a statistics collector with a single row, you need to know many types there are in the model, so you can create the respective number of columns in a reset event. They are then updated by objects entering the Input and Output objects. The occurences of each type (item and possible subnodes) are summed up in the 'delta' event label and then used to update the columns.
15 People are following this question.
FlexSim can help you understand and improve any system or process. Transform your existing data into accurate predictions.
FlexSim is a fully 3D simulation software environment. FlexSim can be used to simulate any process in any industry.
FlexSim®, FlexSim Healthcare™, Problem Solved.®, the FlexSim logo, the FlexSim X-mark, and the FlexSim Healthcare logo with stylized Caduceus mark are trademarks of FlexSim Software Products, Inc. All rights reserved.