question

Maryam H2 avatar image
0 Likes"
Maryam H2 asked Joerg Vogel commented

Validate label by percentage functioning

Hello,

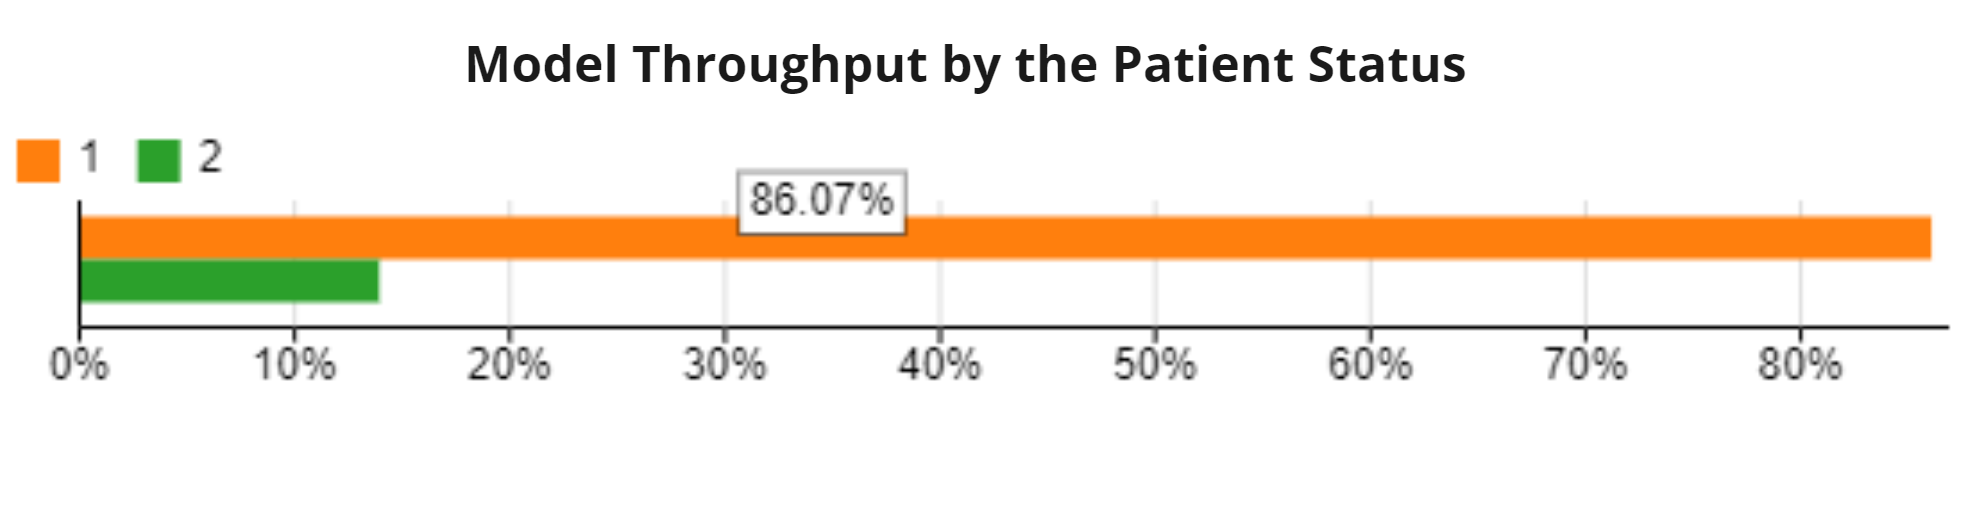
I have several separate patient flows in the model, and for each I labeled 70% of patients to have value X and 30% of them to have value Y under the arrivals tab. Either running the model over replications (25 rep.) or just a single run, when I get the throughput by label (%) I see it is not as I set it (it's more like 15% vs 85% like pic below). Is there any way that I can make it accurate other than importing all labels in Global or Arrival table, or how can I make sure it is labeling based on %?

1670959074051.png

FlexSim 22.2.4
throughputby percentagemodel validation
1670959074051.png (62.7 KiB)
· 2
5 |100000

Up to 12 attachments (including images) can be used with a maximum of 23.8 MiB each and 47.7 MiB total.

Jeanette F avatar image Jeanette F ♦♦ commented ·

Hi @Maryam H2,

It's hard to know how to help without looking at your model. To receive a more accurate solution, please post your model or a sample model that demonstrates your question.

Proprietary models can be posted as a private question visible only to FlexSim U.S. support staff. You can also contact your local FlexSim distributor for phone or email help.

1 Like 1 ·
Joerg Vogel avatar image Joerg Vogel commented ·

Statistic results resolve to set values only by many events not many replications. Can you tell us about evaluated events of your chart. Best would be if you evaluate more then 10.000 events in your chart.

Edit: Such results are expected for different processing times. Process 1 lasts short. Process 2 lasts long. Some events of Process 2 haven’t finished yet. Some haven’t even started, but patients have entered model. You let run your model over three hours. Process 2 lasts over one hour and you can handle two of them simultaneously. But Process 1 lasts only minutes to get completed. Then this chart result looks absolutely accurate for such a setting.

0 Likes 0 ·

1 Answer

·
Felix Möhlmann avatar image
0 Likes"
Felix Möhlmann answered Joerg Vogel commented

Jörg's comment on different process times and a potentially too short model runtime were my thoughts as well.

To validate the distribution, you could use an array label on the process flow itself, that gets incremented directly after the type is assigned.

1671022484878.png

CheckDistribution.fsm


· 6
5 |100000

Up to 12 attachments (including images) can be used with a maximum of 23.8 MiB each and 47.7 MiB total.

Maryam H2 avatar image Maryam H2 commented ·

What if there are only 50 people coming into the model instead of 200? Or multiple patient flows, each with a different arrival counts (50, 20, 100,etc.), then model throughput still doesn't give a correct %.

I created a chart that shows it would not be a 70 vs 30. Please see below.

checkdistribution-mh.fsm

0 Likes 0 ·
Sebastian Hemmann avatar image Sebastian Hemmann Maryam H2 commented ·
I only can underline what Jörg and Felix already explained. If I set your arriving number to 1000 (instead of 50) it perfectly shows the 70/30 behavior you are looking for. So if you want to go with a statistical distribution it seems as if you have to live with this derivation for small number of events . If you do not want to go with a statistical distribution you e.g. could create your own sequence. Or even a set of sequences for different experiments.


I can not find your results in different replications. The first replication seems to show a 45/ 55 % but all next replications are much better for me!

1 Like 1 ·
Maryam H2 avatar image Maryam H2 Sebastian Hemmann commented ·
Got it, thanks!
0 Likes 0 ·
Joerg Vogel avatar image Joerg Vogel Maryam H2 commented ·

Hello @Maryam H2 , there are two concepts of distributions:

  • a fixed ratio like 3:7
  • a statistical distribution which gets near a fixed ratio by huge amount of events.

Probably you still want in a fixed ratio a random arrival. Then you can update a list of available patients to be created in intervals. You start for example with a list of 10 entries: 3 Type A, 7 Type B. Then you pull randomly entries of this list whenever a patient is entering your model to assign a Type. If the list gets empty you update the list again by 10 new entries. Your distribution of entering patients deviates in a range of available list entries. But in intervals of 10 patients your input distribution meets exactly your ratio. Then a statistical output is a result of individual runtime in your model.
Now if you initialize your list with more items and you must update its content in larger intervals, you can increase randomness.

0 Likes 0 ·
Maryam H2 avatar image Maryam H2 Joerg Vogel commented ·
Thanks, @Joerg Vogel

Do you have a simple model that shows what you said? I do not understand whether you assign the type of the entry first or we can create such a thing that monitors the ratio based on type of entries.

0 Likes 0 ·
Show more comments

Write an Answer

Hint: Notify or tag a user in this post by typing @username.

Up to 12 attachments (including images) can be used with a maximum of 23.8 MiB each and 47.7 MiB total.