I know we have utilization of operator or resource for the entire simulation run. How do I get this statistics for every hour? I have some hours with low or zero demand. The current statistics is showing the average utilization to be low due to those hours. Utilization by hour would be more insightful
I actually build something like this for a recent project. You have to measure the total time spent in 'utilized' states in an interval, so you can calculate the utilization rate within said time interval.
The system I use consists of two Statistics Collectors. The 'Core' collector measures the total utilized time of the objects in a fixed interval. The second collector then uses that data to calculate the utilization every time a new measurement is taken.
All settings are controlled by labels on the 'Core' collector.
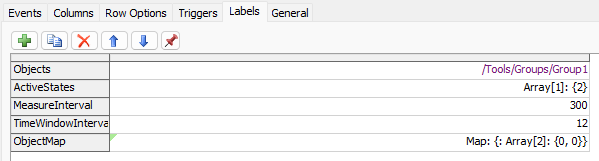
Objects has to point to a group that contains the objects for which you want to measure the utilization.
ActiveStates contains all states (as numbers) that should be counted as utilized. You can get the state numbers through the defines "STATE_...". In the example only the 'processing' state counts as active. (For an operator these would be states like TRAVEL_EMPTY, OFFSET_TRAVEL_LOADED, etc.)
MeasureInterval is the time interval in model time units in which the measurement is taken.
TimeWindowIntervalMultiple controls how many data points are kept by the core collector. The second collector will calculate the averate utilization over all of those data points. In the example above a measurement is taken every 300s and 12 values are kept. As a result, each data point of the second collector stands for the average utilization over the last 12*300s = 3600s = 1h. Since the value is updated every 300s you end up with a sliding window.
The final label is used to keep track of data that is needed during the model run and should not be changed manually.
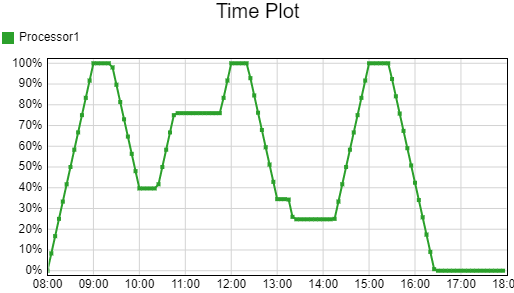
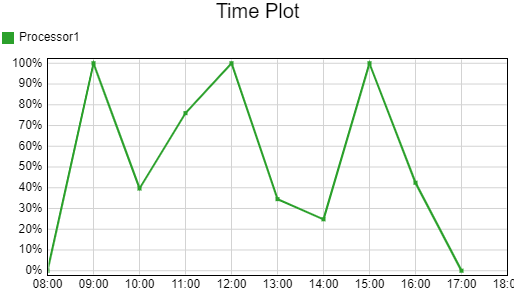
Below are two example graphs, the first with the settings you see above and the second with one measurement every 1h (MeausureInterval = 3600, TimeWindowIntervalMultiple = 1). Note that the data points at each full hour are the same.
14 People are following this question.
