question

Jujuiker avatar image
1 Like"
Jujuiker asked Diego Avila edited

How to do a content vs time graph?

FlexSim 23.1.1
timetablesgraphs
5 |100000

Up to 12 attachments (including images) can be used with a maximum of 23.8 MiB each and 47.7 MiB total.

Diego Avila avatar image
1 Like"
Diego Avila answered Diego Avila edited

Hi @Jujuiker ,

Another alternative is opening the Dashboards library and once you select your Content (Line) chart you need to sample the object you want to start graphing.

1686590717613.png


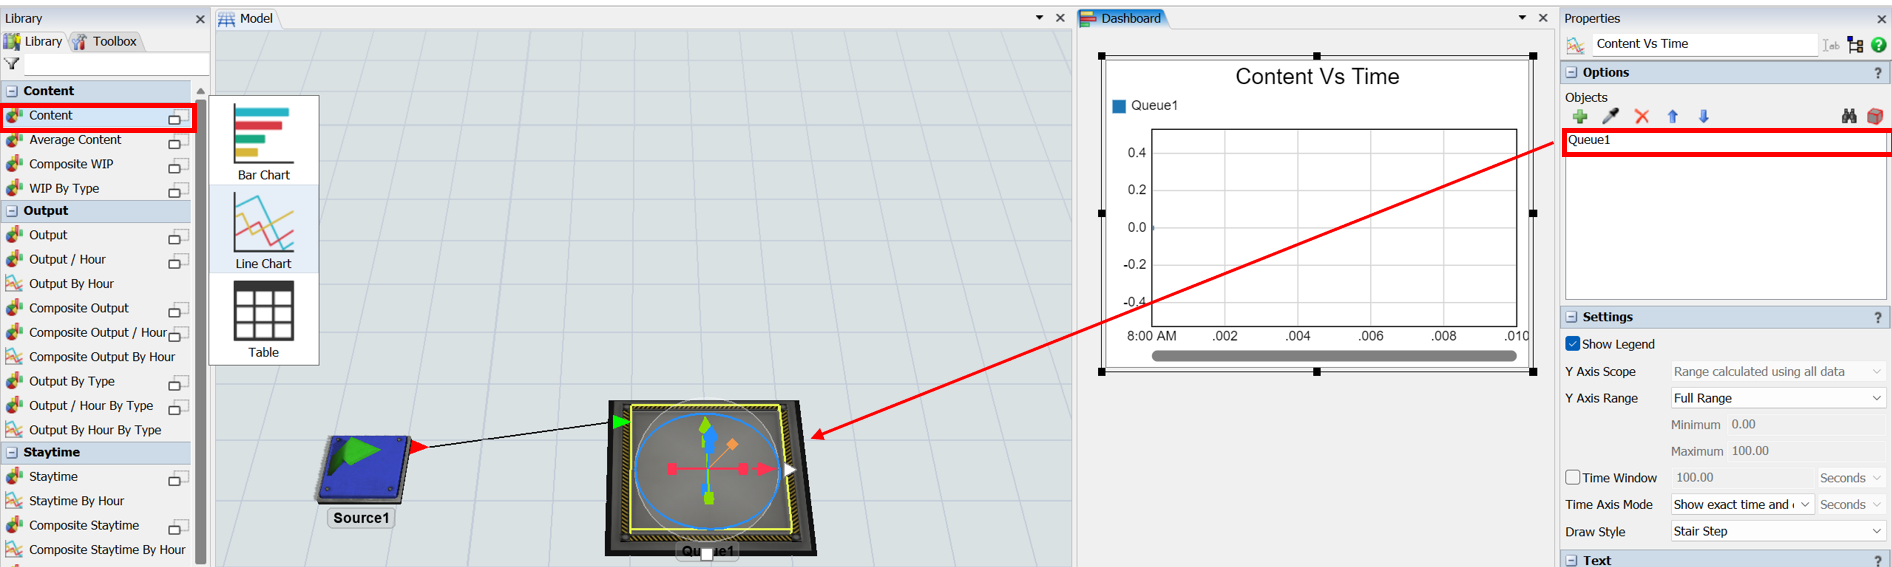
Either of the proposals work exactly the same.


1686590717613.png (339.0 KiB)
5 |100000

Up to 12 attachments (including images) can be used with a maximum of 23.8 MiB each and 47.7 MiB total.

Joerg Vogel avatar image
1 Like"
Joerg Vogel answered

content-vs-time-linegraph.png
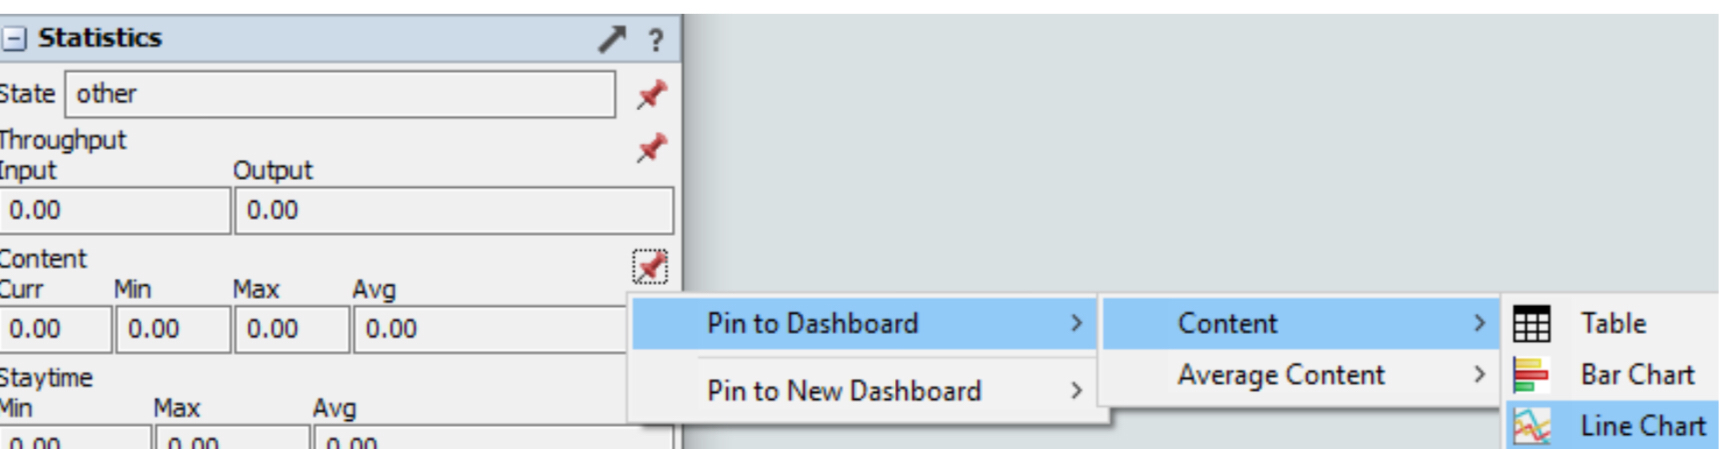
quick properties click path


5 |100000

Up to 12 attachments (including images) can be used with a maximum of 23.8 MiB each and 47.7 MiB total.

Write an Answer

Hint: Notify or tag a user in this post by typing @username.

Up to 12 attachments (including images) can be used with a maximum of 23.8 MiB each and 47.7 MiB total.