question

GRodea avatar image
0 Likes"
GRodea asked Felix Möhlmann commented

Show the maximum capacity of the rack in Dashboard

Hello!

I am trying to show the maximum capacity of the racks in the dashboard, how is that possible? This is to know the overall usage of my racks.

1688385146740.png

FlexSim 23.1.3
dashboardsracksmaximum capacity
1688385146740.png (207.6 KiB)
5 |100000

Up to 12 attachments (including images) can be used with a maximum of 23.8 MiB each and 47.7 MiB total.

1 Answer

·
Paula LG avatar image
0 Likes"
Paula LG answered Felix Möhlmann commented

Hi,

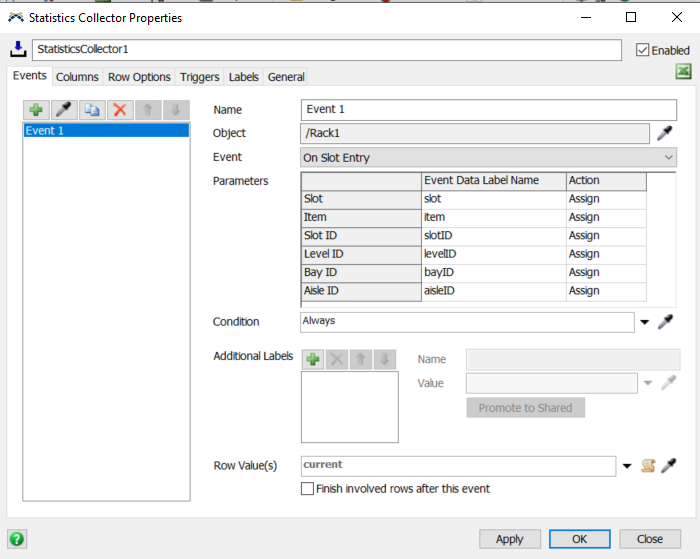
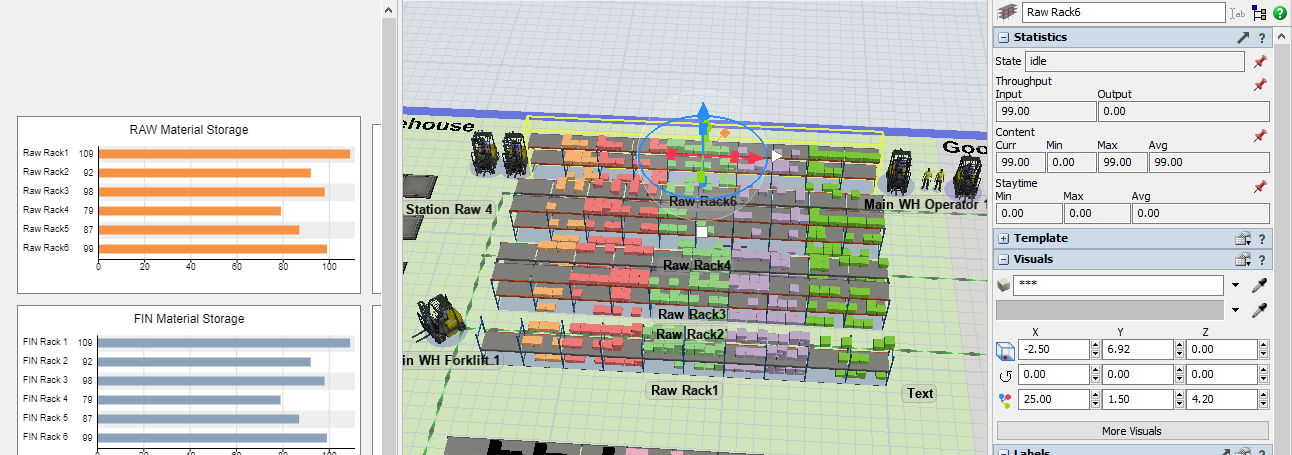
I have created an example model using a statistics collector that calculates the percentage of empty and occupied slots based on the total number of slots of the rack. With that data collected, you can choose any base chart you want to illustrate the results. I hope it helps!

23.1 Statistics Warehouse Usage.fsm


· 18
5 |100000

Up to 12 attachments (including images) can be used with a maximum of 23.8 MiB each and 47.7 MiB total.

GRodea avatar image GRodea commented ·

Thanks a lot for you kind support. Is there a possibility to do it without coding?

When I copy pasted the code to my model, It is just showing the values of my initial stock I created using a list but showing how it changes along the time. How to fix this?

0 Likes 0 ·
Paula LG avatar image Paula LG GRodea commented ·

You need to make sure that the event that updates the statistics collector is "On Slot Entry" of your rack, and that the Row Value is current.

1688537161814.png

If it still doesn't work as desired, you can attach your model here and I'll look it up for you!

0 Likes 0 ·
1688537161814.png (79.2 KiB)
GRodea avatar image GRodea Paula LG commented ·
thanks Paula for the follow up. I was running with different values for the source and even when the rack is NOT full in the 3D model, the statistics collector is showing 100% full. Could you please verify?


I am also wondering if its possible to do it without coding.

0 Likes 0 ·
Show more comments
GRodea avatar image GRodea commented ·

Hello Paula,

If you see, in the handover stations and quarantine for example, the value of used should be really low but it is showing overall the same values for all the racks.

Thanks

Example.fsm

0 Likes 0 ·
example.fsm (297.6 KiB)
GRodea avatar image GRodea commented ·

Thanks a lot for both approaches. In Paula's approach in the new file: 231 statistics warehouse usage, If I am understanding properly, once it's full, it should show 100%, but only when it's full shows only 50%.

For the volume part is do understand the logic. In my model, I would like to understand the same metric but by type of box used in the rack (I have 9 different type) all using the same size so it is fine using the slots approach.Example.fsm

0 Likes 0 ·
example.fsm (297.6 KiB)
Paula LG avatar image Paula LG GRodea commented ·

The reason why the statistics collector is showing nearly the same values for all the racks is because the code on the example model calculates the % considering all the slots in the storage system. To calculate this number having multiple racks, you need to add labels to the query, so that it only considers the slots you want.

I attach a new model with two racks to clarify what I mean.

23.1 Statistics Warehouse Usage.fsm

0 Likes 0 ·
GRodea avatar image GRodea Paula LG commented ·

Hello Paula, thanks for the reply.

It is not showing the real capacity of the racks, as you can see in the screenshot, once I full the rack, the table is showing 100% but in the 3d model is not 100% full.

not-showing-properly.png

Thanks a lot!

0 Likes 0 ·
Show more comments

Write an Answer

Hint: Notify or tag a user in this post by typing @username.

Up to 12 attachments (including images) can be used with a maximum of 23.8 MiB each and 47.7 MiB total.