question

Ankur A3 avatar image
0 Likes"
Ankur A3 asked Ankur A3 commented

Tracking actual cause of blockage and duration?

Hi Team,

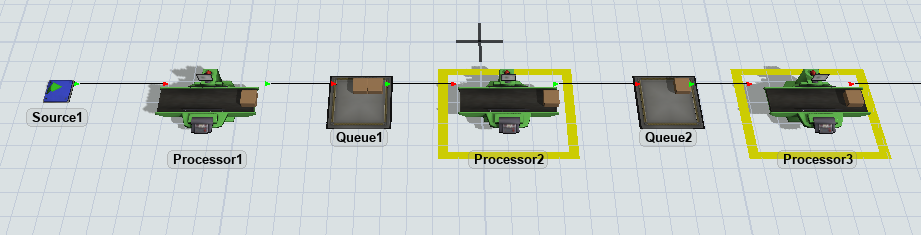
I am trying to model the system where we have 3 processors in series having buffer in between.
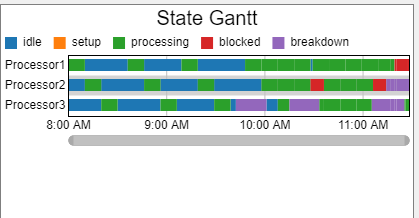
Proc1, Proc2, Proc3

Proc2 have availability of 90% and Proc3 have availability of 80%

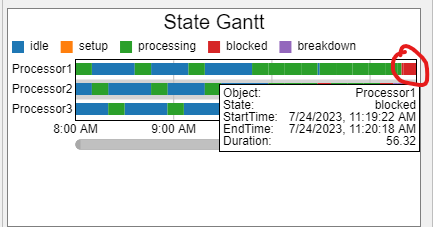
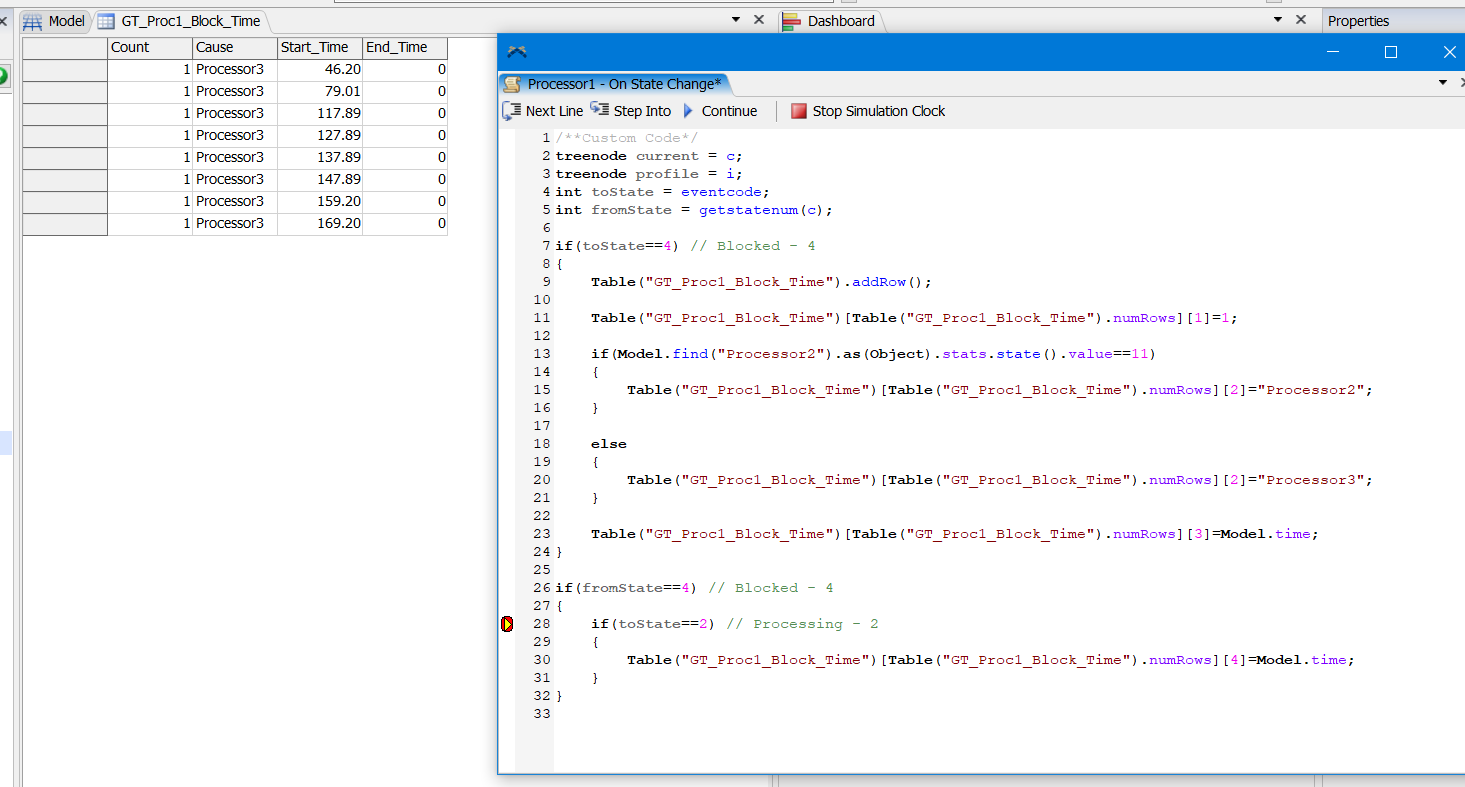
I would like to know the cause of blockage at Proc1 whether due to Proc2 or Proc3. Also, the time of blockage.

What is the best way to get these statistics?

Thank you!

24.07.2023_Tracking_Blockage_Cause.fsm

FlexSim 23.1.2
timeblocktrackcause
5 |100000

Up to 12 attachments (including images) can be used with a maximum of 23.8 MiB each and 47.7 MiB total.

1 Answer

·
Carter Walch avatar image
0 Likes"
Carter Walch answered Ankur A3 commented

Hi @Ankur A3 ,

An easy way to see these statistics is to create a "State Gantt" chart in your dashboard and attach each processor to the dashboard. This shows the states of the processors and includes at what times they occur. For example, we see that Processor1 goes into a blocked state first at 11:19. We can also see that Processor 2 AND Processor 3 are in a breakdown state at that time.

1690213926157.png

1690213938131.png

When we pause the model at that time, we can see the blocked item. Processor1 is blocked because Proc2 is in breakdown and Queue1 has max content of 2 so it can't receive the item from Processor1. Just before that, Processor2 got blocked due to Processor3 going into breakdown. The State Gantt chart helps us see the order of these state changes and when they happen

1690214090962.png

24072023-tracking-blockage-cause.fsm


· 14
5 |100000

Up to 12 attachments (including images) can be used with a maximum of 23.8 MiB each and 47.7 MiB total.

Ankur A3 avatar image Ankur A3 commented ·
Hi @Carter Walch,

Thank you for your response.

It is showing the info what is required but difficult to track for many occurances.

I would like to know if we can get it in tabular format so that it will be easy to filter the information based on legends.

Thank you!

0 Likes 0 ·
Ankur A3 avatar image Ankur A3 Ankur A3 commented ·

Hi @Carter Walch,

I am trying to capture the data in global table, but state change trigger is not working as expected.

1690280447772.png


Here is the model for your reference.

Thank you!

25.07.2023_Tracking_Blockage_Cause.fsm

0 Likes 0 ·
Jason Lightfoot avatar image Jason Lightfoot ♦ Ankur A3 commented ·
Why are you trying to do this in a global table ? Install the chart and use its stats collector. Use talble queries or calculated tables to transform the data.
0 Likes 0 ·
Show more comments

Write an Answer

Hint: Notify or tag a user in this post by typing @username.

Up to 12 attachments (including images) can be used with a maximum of 23.8 MiB each and 47.7 MiB total.