question

Maryam H2 avatar image
0 Likes"
Maryam H2 asked Maryam H2 commented

Traveling Distance Chart

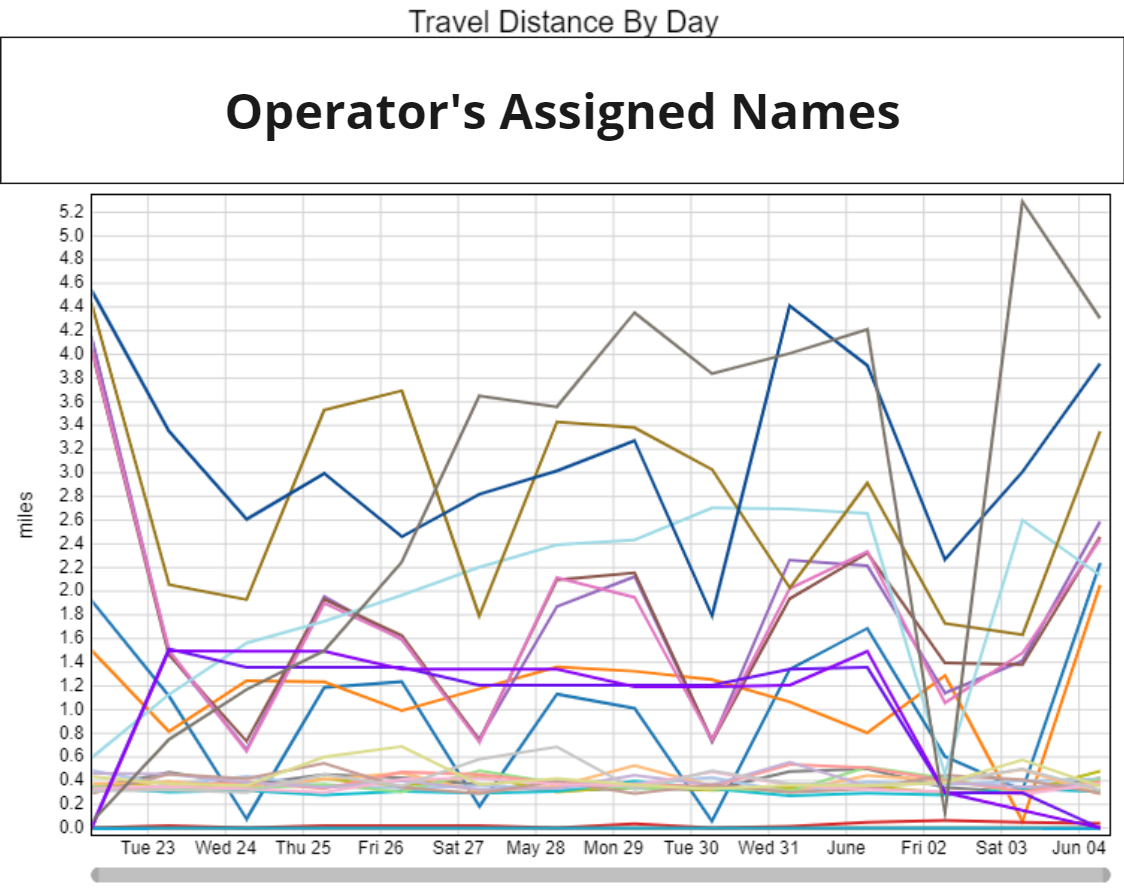
I've run my model, and I've noticed that the traveling distance chart displays as follows:

  • Firstly, I'm curious about why some operators' traveling distances start at such high numbers, like 4.5 miles. Shouldn't they all begin from 0, given that the x-axis represents time?
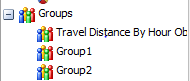
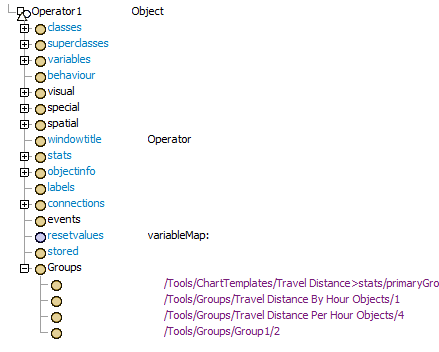
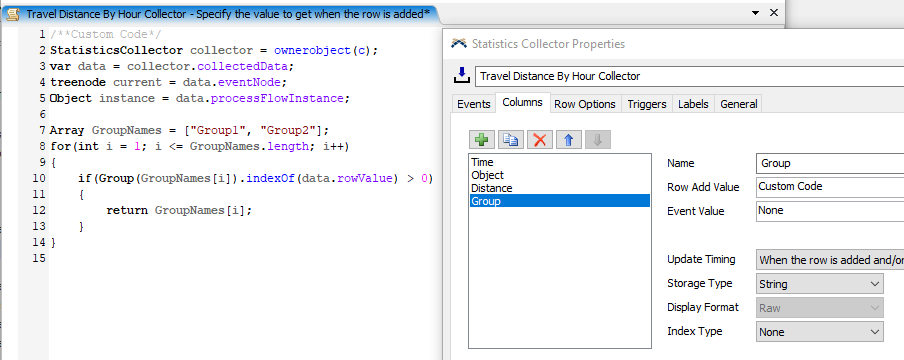
  • Second, I'm wondering how I can group operators who belong to the same resource group. I remember this was possible in the HC environment, but I'm uncertain about how to do it in the General environment.
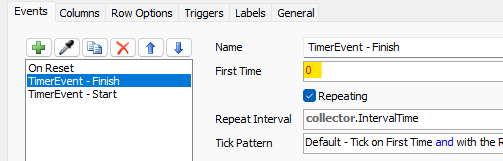
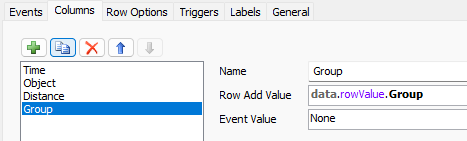
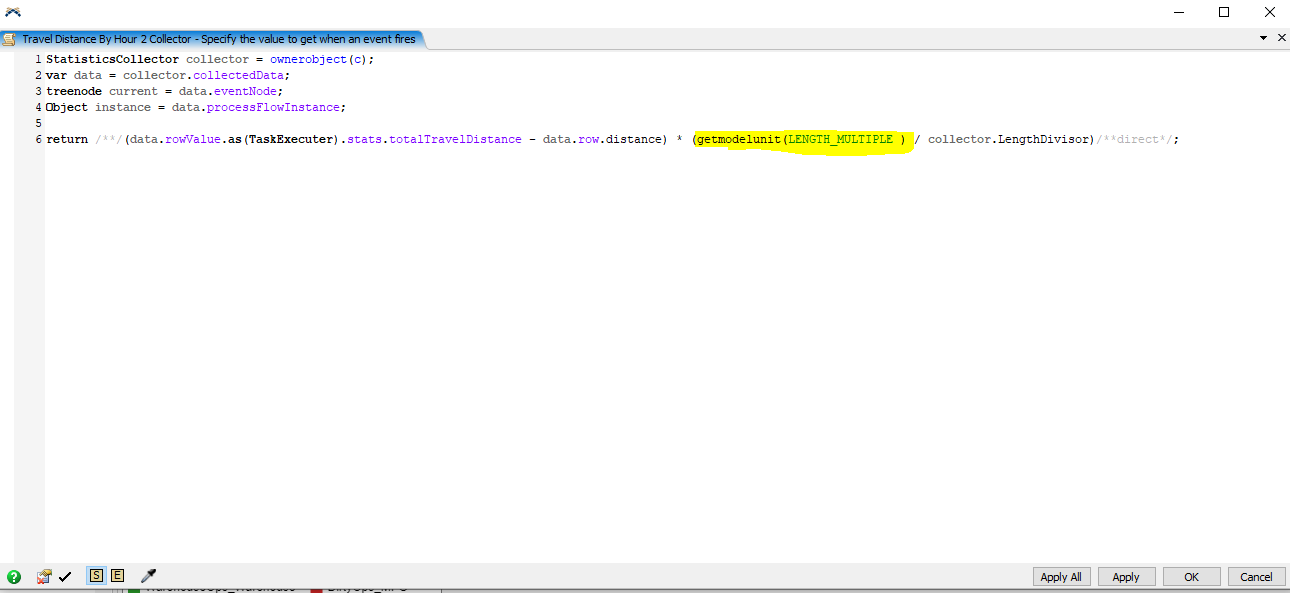
  • Third, I've observed that there doesn't appear to be any significant difference between the Travel Distance Chart and the Travel Distance per Hour chart. In fact, in some runs, I've even seen higher values for the latter. Can anyone clarify how the travel distance per hour is calculated?


1696878795299.png


FlexSim 23.2.0
distance traveledby hourtraveling distance
1696878795299.png (474.8 KiB)
5 |100000

Up to 12 attachments (including images) can be used with a maximum of 23.8 MiB each and 47.7 MiB total.

1 Answer

·
Felix Möhlmann avatar image
0 Likes"
Felix Möhlmann answered Maryam H2 commented

The travel distance by hour start by default does not add a data point for the model start. The first value you see corresponds to the travel distance in the first timed interval. If you want the chart to start at the model start time, you can install the chart's components and change the "First Time" value of the second and third in the Statistics Collector to 0.

1696926089085.png

A relatively easy solution would be to add an extra column that denotes which group an operator belongs to to the charts's Statistics Collector (I use a label on the operators for this - "data.rowValue" is a reference to the respective operator in the Statistics Collector). You can then use a Calculated Table to sum up the distances per time and group.

1696926105778.png

travel_by_distance_fm.fsm

I can't comment on your last point. In the attached model, the total distance and distance by hour seem correct.


· 5
5 |100000

Up to 12 attachments (including images) can be used with a maximum of 23.8 MiB each and 47.7 MiB total.

Maryam H2 avatar image Maryam H2 commented ·

Hi @Felix Möhlmann

Thanks for your response. I'm clear on the first point.

For the second point, my operators are grouped differently, as shown below in the image, Could you advise on how to adjust the calculated table query or Row Add Value operation accordingly, considering this grouping?


1696946340043.png

Regarding the third point, the travel distance per hour chart shows a higher value than the actual traveled distance. Can you please check the attached model and explain how it calculates the number per hour in that chart?

Thanks

travel-by-distance-fm_1.fsm

0 Likes 0 ·
Felix Möhlmann avatar image Felix Möhlmann Maryam H2 commented ·

You'd need a list of groups the operator could be part of, so you can check wether the the operator is actually part of any of them. Either by going through the groups and checking the index of the operator (a positive number, if the operator is in the group). Or go through the groups the operator is part of (see operator's attributes tree) and compare their names to those of interest.

capture1.png

capture2.png


The distance per hour is the travelled distance divided by the number of hours since model start/warmup time. So before at least one hour has passed, that value will naturally be larger than the travelled distance.

For example, an operator travelled 100m in 1 minute. Scaled to one hour, he travelled 6km per hour. As you can see, you can also think of the distance per hour as the average speed of the operator.

0 Likes 0 ·
capture1.png (11.2 KiB)
capture2.png (32.7 KiB)
Maryam H2 avatar image Maryam H2 Felix Möhlmann commented ·

@Felix Möhlmann Thanks for the clarifications, it worked perfectly!

Could you just tell me how I can change the unit in both Travel Distance by hour as shown below (my model is created in feet but I want to change the unit to miles):

1696954520499.png


Also, how I change the unit in Time plot?

0 Likes 0 ·
1696954520499.png (38.3 KiB)
Show more comments

Write an Answer

Hint: Notify or tag a user in this post by typing @username.

Up to 12 attachments (including images) can be used with a maximum of 23.8 MiB each and 47.7 MiB total.