question

Karan avatar image
0 Likes"
Karan asked Karan commented

Understanding the AStar Heatmap

Hi,

I am trying to understand if there is a way to quantify the colors of the heat map and compare them: like Red = x% of total traversals, Green = y% of total traversal,
The units "% of total traversals" are just an example, they could be changed to something more appropriate as long as the quantitative data remains consistent for comparison.

I looked at Matthew's answer here How are the A* heat map colors calculated? - FlexSim Community but based on the calculation couldn't quite figure how to achieve what I am looking for.

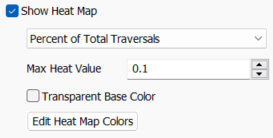
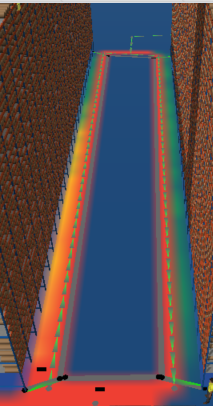
My max heat value is 0.1 and the map is set to Percent of Total Traversals, in my heat map I understand that the Reds are most travelled, and Green/Blues are least travelled.

1700578472037.png

1700578794134.png
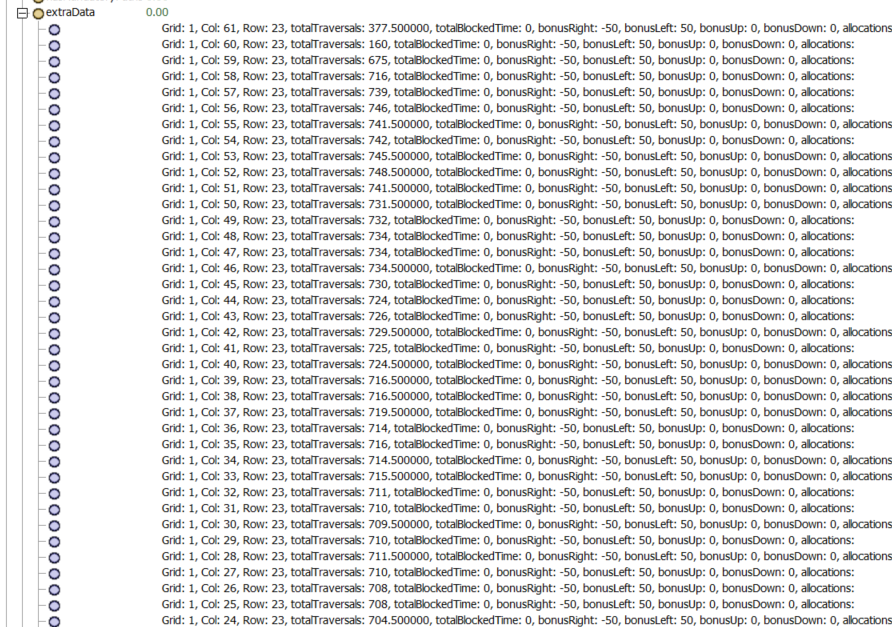
I also found Joshua's answer here Heat map gradient - FlexSim Community however, I don't think that answers the question of how to translate the colors into numbers.. I see the AStar grid node data but not sure which node translates to what point on the heat map.

1700578957168.png


Let me know if something is unclear, thank you for your time!

FlexSim 23.2.2
a star navigationheat map
1700578472037.png (15.2 KiB)
1700578794134.png (128.1 KiB)
1700578957168.png (531.7 KiB)
5 |100000

Up to 12 attachments (including images) can be used with a maximum of 23.8 MiB each and 47.7 MiB total.

1 Answer

·
Felix Möhlmann avatar image
1 Like"
Felix Möhlmann answered Karan commented

Based on Matthew's post, if you set the Max Heat Value to 0.1 and use the Percent of Total Traversals mode, then any node that tracked 0.1% or more of the total traversals will be colored 'solid' red. Below that, the colors gradually shift into each other linearly (0.05% would be yellow for example).

First, the percentage of traversals that belong to a node is calculated (weight). This percentage value is then divided by the Max Heat Value and clamped to the interval between 0 and 1. (So any weight that was larger than 0.1 becomes 1 at this point.

This value is then multiplied by the number of different colors - 1, so we end up with a number between 0 and 4. The whole number value at this determines the base color (0 = blue, 1 = green, 2 = yellow, 3 = orange, 4 = red) and the fractional value determines how far this base color is shifted towards the next color in the progression. 2.5, for example, would thus result in a 50/50 mix between yellow and orange.

· 1
5 |100000

Up to 12 attachments (including images) can be used with a maximum of 23.8 MiB each and 47.7 MiB total.

Karan avatar image Karan commented ·

Thank you for the response, Felix. That makes sense. Knowing that max heat is a percentage and that translates to red allows me to calculate the number of traversals per color as well.

0 Likes 0 ·

Write an Answer

Hint: Notify or tag a user in this post by typing @username.

Up to 12 attachments (including images) can be used with a maximum of 23.8 MiB each and 47.7 MiB total.