question

Arun avatar image
0 Likes"
Arun asked Arun commented

Gannt chart

Hi,

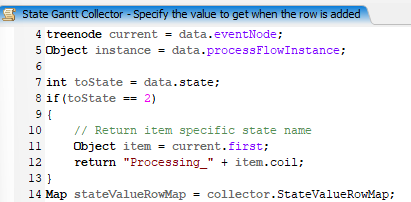
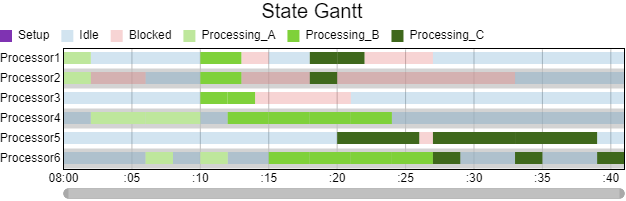
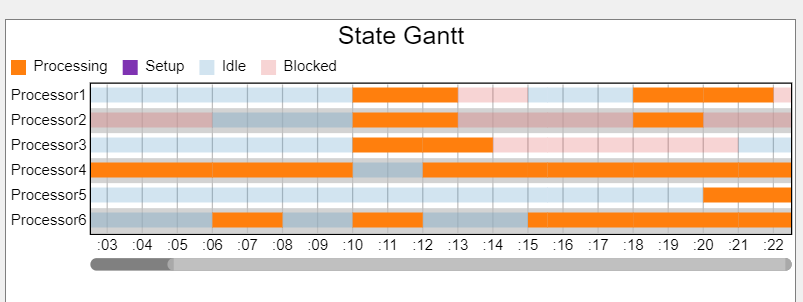
I have three items (A, B, C) which will go through processors. when I try to create a dashboard Gantt chart can I give a distinct color to the processing state w.r.t item type. e.g For type A processing color should be green in gannt chart where type B is blue and type C should be yellow.

1712249125278.png

Thanks in advance

Arun

test.fsm

FlexSim 24.0.2
dashboard datastate statisticsgannt
1712249125278.png (25.0 KiB)
test.fsm (35.2 KiB)
5 |100000

Up to 12 attachments (including images) can be used with a maximum of 23.8 MiB each and 47.7 MiB total.

1 Answer

·
Felix Möhlmann avatar image
0 Likes"
Felix Möhlmann answered Arun commented

I would suggest the following:

Install the gantt chart's components. (see Advanced tab in the chart properties). This will make the Statistics Collector for the chart available in the toolbox.

In the Columns tab of the collector, alter the code for the State column, so that if the state changes to processing, a custom value is assigned to the column rather than the actual state name.

1712301328249.png

1712301203284.png

The actual state of the processor will stay as just "processing". There are also ways to change that, but if the differentiation should only appear in the state gantt than I think this is the more elegant approach.

split-state-in-gantt-fm.fsm


· 1
5 |100000

Up to 12 attachments (including images) can be used with a maximum of 23.8 MiB each and 47.7 MiB total.

Arun avatar image Arun commented ·

Great, Its working. Thanks

0 Likes 0 ·

Write an Answer

Hint: Notify or tag a user in this post by typing @username.

Up to 12 attachments (including images) can be used with a maximum of 23.8 MiB each and 47.7 MiB total.