question

Mohamed Eldakroury avatar image
0 Likes"
Mohamed Eldakroury asked Mohamed Eldakroury commented

GIS Output charts

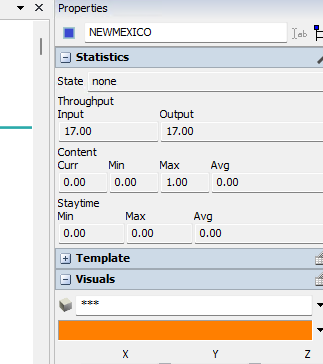
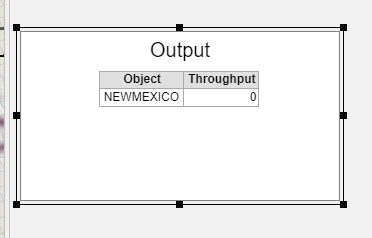
I built a GIS model that send flow items from Factories to customers using process flow. The conventional dashboards where I can sample a map point into an output chart doesn't seem to work. When I click on the point though, I see the input and output numbers in the properties window. However the chart/table would show Zeros.


1733323729178.png


1733323772274.png


How do I get the charts to work with map points?

FlexSim 24.2.1
gismappoints
1733323729178.png (14.2 KiB)
1733323772274.png (6.3 KiB)
5 |100000

Up to 12 attachments (including images) can be used with a maximum of 23.8 MiB each and 47.7 MiB total.

1 Answer

Mohamed Eldakroury avatar image
0 Likes"
Mohamed Eldakroury answered Mohamed Eldakroury commented

Here's an example model that was posted on this forum a while back. I pinned the chart and it still shows zero.


GISCHARTS.fsm


gischarts.fsm (2.1 MiB)
· 2
5 |100000

Up to 12 attachments (including images) can be used with a maximum of 23.8 MiB each and 47.7 MiB total.

Felix Möhlmann avatar image Felix Möhlmann commented ·

Pinning stats to a dashboard uses two Statistics Collectors. One to create a row and store the current time for each entry/exit event (so they can be used for a line chart) and one collector that simply counts the number of events of the other collector. The GIS points do not possess entry and exit events, so this structure does not work for them.

You can use the "Whenever value is accessed" update timing in a custom Statistics Collector though, since reading the stats with the "getstat()" command works normally.

gischarts_1.fsm

1 Like 1 ·
gischarts-1.fsm (2.7 MiB)
Mohamed Eldakroury avatar image Mohamed Eldakroury Felix Möhlmann commented ·
Thank you, that worked!


I have another question about route cost but will make a new post.
0 Likes 0 ·