question

Aldo P avatar image
0 Likes"
Aldo P asked Aldo P commented

how can I configure state reports to be readable in excel?

excel interface
· 1
5 |100000

Up to 12 attachments (including images) can be used with a maximum of 23.8 MiB each and 47.7 MiB total.

1 Answer

Kari Payton avatar image
2 Likes"
Kari Payton answered Aldo P commented
@Aldo P

You can use a dashboard to show the state of a resource.

1. Add new dashboard using the toolbar at the top of the program.

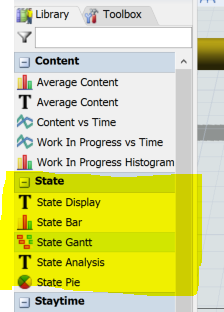
2. In the dashboard library, add a State Pie or State Gantt or State Analysis chart.

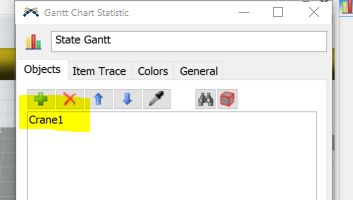
3. For each chart, add your resource to it.

4. After the model runs, on the dashboard properties click the save icon. Then you can save each dashboard as a CSV file.
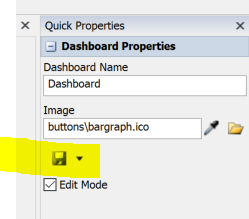
save.png


state.png (32.1 KiB)
chart.png (17.7 KiB)
save.png (15.0 KiB)
· 2
5 |100000

Up to 12 attachments (including images) can be used with a maximum of 23.8 MiB each and 47.7 MiB total.