Hello
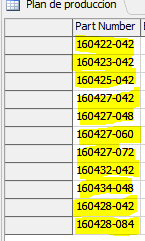
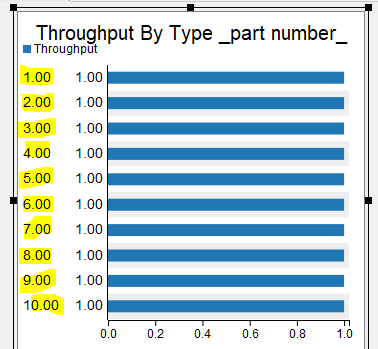
I have a problem creating a bar graph that is plotted based on the "part number" column of the table.
How could the item.type be changed by the "part number" of the table in the graph?
i share de model
i hope you can help me
Hello
I have a problem creating a bar graph that is plotted based on the "part number" column of the table.
How could the item.type be changed by the "part number" of the table in the graph?
i share de model
i hope you can help me
Is this the chart you are looking for?
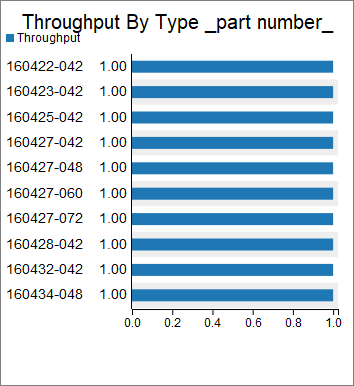
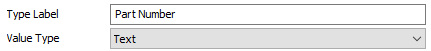
To get this chart, I double-clicked on the chart in your model, and I change these two things on the first tab:
10 People are following this question.
FlexSim can help you understand and improve any system or process. Transform your existing data into accurate predictions.
FlexSim is a fully 3D simulation software environment. FlexSim can be used to simulate any process in any industry.
FlexSim®, FlexSim Healthcare™, Problem Solved.®, the FlexSim logo, the FlexSim X-mark, and the FlexSim Healthcare logo with stylized Caduceus mark are trademarks of FlexSim Software Products, Inc. All rights reserved.
May we collect and use your data?
Learn more about the Third Party Services we use and our Privacy Statement.May we collect and use your data to tailor your experience?
Explore the benefits of a customized experience by managing your privacy settings for this site or visit our Privacy Statement to learn more about your options.