question

Xiu Z avatar image
0 Likes"
Xiu Z asked Jordan Johnson commented

How to get avg wait time for specific staff in the dashboard?

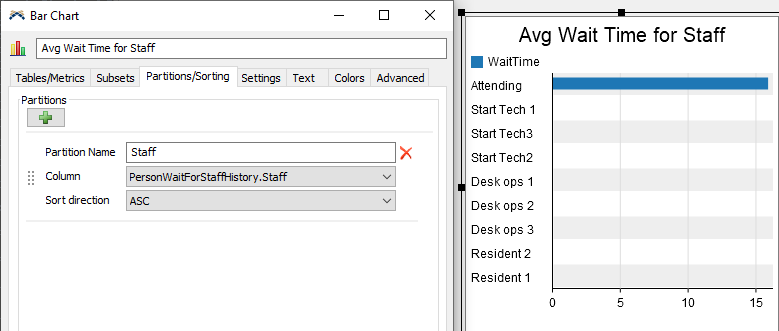
v2-oph-10242019.fsmThe key measurement of my model is patients' wait time for location as well as for staff. I need to know which staff/location specifically is patient wait for the longest. Can I do that?

Also, why is my Avg State chart indicates looooong staff idle time and very limited "provide care" time? What did i do wrong?

FlexSim 19.2.2
dashboardshealthcare hc
5 |100000

Up to 12 attachments (including images) can be used with a maximum of 23.8 MiB each and 47.7 MiB total.

1 Answer

·
Jordan Johnson avatar image
0 Likes"
Jordan Johnson answered Jordan Johnson commented

I think the issue with your state chart is that the model units are in seconds. This means that the start patient process takes a maximum of 30 seconds, and the patient exam takes a maximum of 27 seconds. Since only a few people arrive each hour, that means there is a lot of idle time for the staff. You can use the minutes() command to convert those times correctly:

triangular(minutes(10), minutes(20), minutes(30))

As far as showing individuals, the easiest way to do that is to add a partition that uses the Staff column on the Staff chart:

Note that I changed the Settings of the bar chart to show zero column, in order to get all the staff to appear.

You can do the same thing for the Locations.

v2-oph-location-staff-charts.fsm

Also be aware that this task will be easier in future versions of FlexSim.


· 4
5 |100000

Up to 12 attachments (including images) can be used with a maximum of 23.8 MiB each and 47.7 MiB total.

Xiu Z avatar image Xiu Z commented ·

Thanks! Is there a way to change the model units to minutes as all my data are collected in minutes? And do I need to remove the minutes() commend after that or that's not necessary?

0 Likes 0 ·
Jordan Johnson avatar image Jordan Johnson ♦♦ Xiu Z commented ·

In FlexSim, you choose your model units when you make a new model. It isn't possible to change them afterward. If you are in the HealthCare environment, it should default to using minutes as the model units.

Now that I think about it, you can maybe simplify to use minutes() just once:

minutes(triangular(10, 30, 20))
0 Likes 0 ·
Xiu Z avatar image Xiu Z commented ·

@jordan.johnson I just noticed that in the bar chart under Metric Options, the Time Units can be changed to minutes, would that be another option to solve this?

0 Likes 0 ·
Jordan Johnson avatar image Jordan Johnson ♦♦ Xiu Z commented ·

The bar chart can display the data it gathered in minutes, but the data that is gathered is still too short. If someone waits for an average of 20 seconds for a staff member, the bar chart will sow that they waited 0.33 minutes.

0 Likes 0 ·

Write an Answer

Hint: Notify or tag a user in this post by typing @username.

Up to 12 attachments (including images) can be used with a maximum of 23.8 MiB each and 47.7 MiB total.