question

Flavio Oliveira_de_brito avatar image
3 Likes"

High Token Execution Time in FlexScript Code Profile

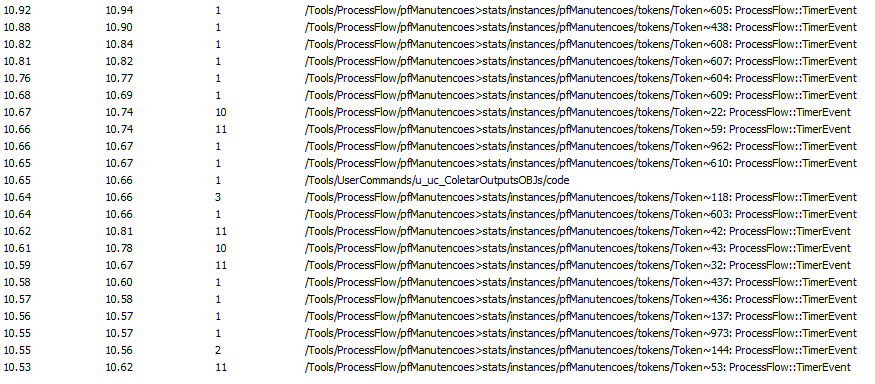
I'm updating a model to version 20.0.2 but the execution time is much higher than before (before the model was running in 49.4 minutes and now is 103.9 minutes, 110% slower) and analysing the FlexScript Code Profile the event with the path "/Tools/ProcessFlow/pfManutencoes>stats/instances/pfManutencoes/tokens/Token~81: ProcessFlow::TimerEvent" associated to many different tokens (about 500) is repeated, what makes me believe that this events is causing the model slow. Below is part of FlexScript code profile:

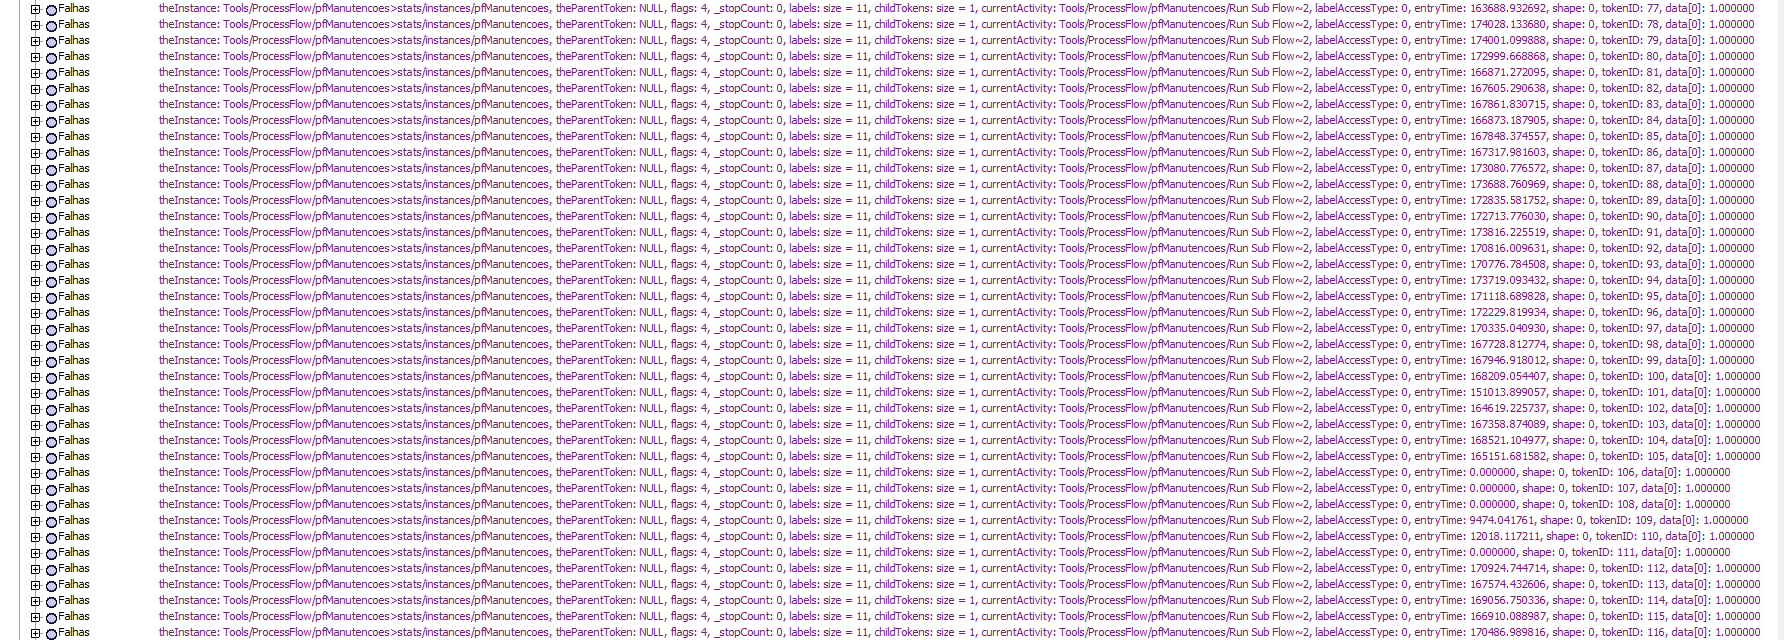
Looking for this event in the tree, all of them is in "Run Sub Flow":

Usually the events in FlexScript Code Profile is associated to a FlexSim code, but in this case I don't know where/what change to decrease execution time. Any suggestion?

Thanks

FlexSim 20.0.2
process flowsimulation timecode profile
tree.png (194.8 KiB)
· 1
5 |100000

Up to 12 attachments (including images) can be used with a maximum of 23.8 MiB each and 47.7 MiB total.

Brenton King avatar image Brenton King ♦ commented ·

Flavio, I'd recommend sending us your model so that we can investigate further. Obrigado!

0 Likes 0 ·

1 Answer

·
Matthew Gillespie avatar image
0 Likes"
Matthew Gillespie answered

You could try the new updated Performance Profiler in the 20.1 beta to see if that gives you any more clarity.

· 1
5 |100000

Up to 12 attachments (including images) can be used with a maximum of 23.8 MiB each and 47.7 MiB total.

Flavio Oliveira_de_brito avatar image Flavio Oliveira_de_brito commented ·

Thanks @Matthew Gillespie, seems very good this new tool, I'll check it in my model to clarify the execution time.

0 Likes 0 ·

Write an Answer

Hint: Notify or tag a user in this post by typing @username.

Up to 12 attachments (including images) can be used with a maximum of 23.8 MiB each and 47.7 MiB total.